B. subtilis Expression Data Browser
Start Page
B. subtilis Expression Data Browser
Gene/Segment:
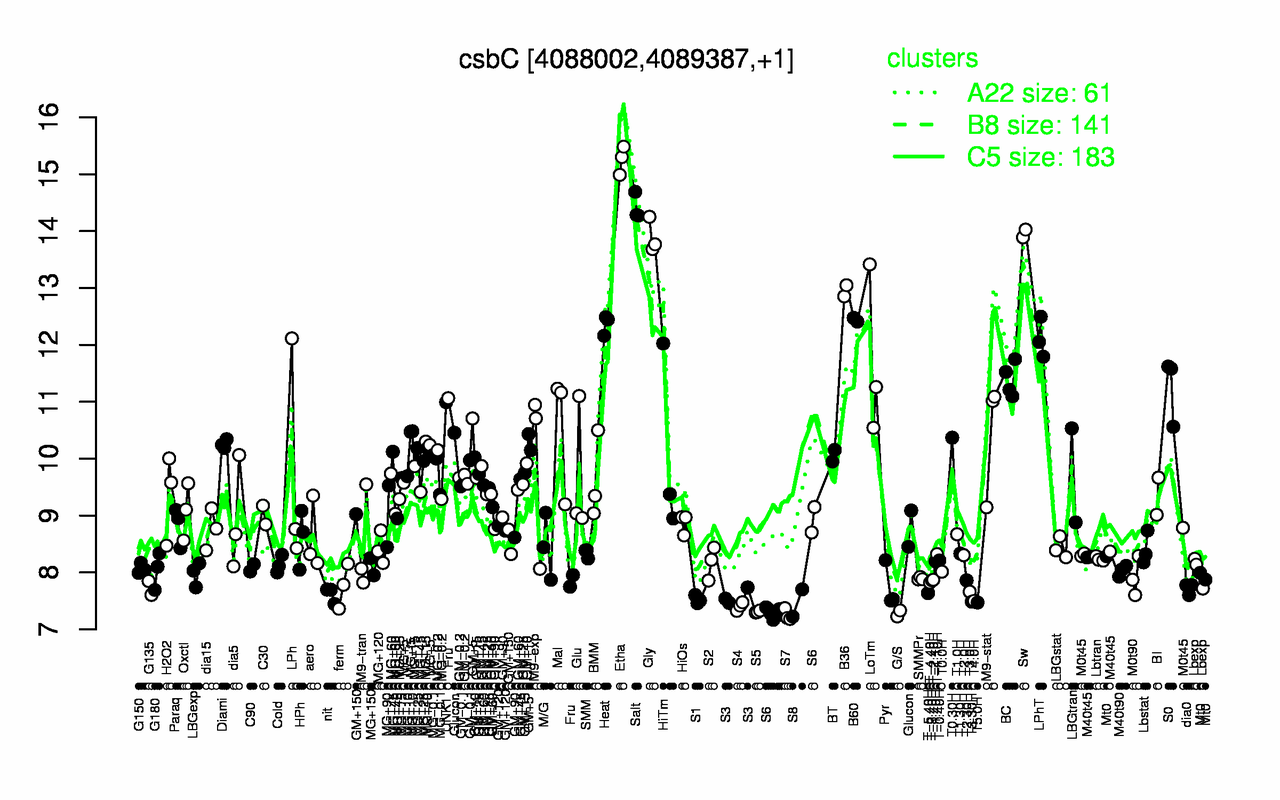
csbC
Locus Tag:
BSU39810
Details about csbC
Show/Hide
Highest Expression Conditions
Etha
Salt
Sw
Gly
B36
B60
Heat
LPhT
LoTm
BC
15.3
14.4
14
13.9
13
12.4
12.4
12.1
11.7
11.4
Lowest Expression Conditions
S7
G/S
S5
S4
S8
T5.0H
T3.30H
T4.0H
S1
S3
7.25
7.28
7.31
7.4
7.46
7.47
7.49
7.5
7.52
7.58
Most Positively Correlated Segments
yflA
ywtG
ycdF
yfhK
csbD
ywiE
yqhB
yhdN
yxbG
S292
0.94
0.93
0.93
0.93
0.93
0.92
0.92
0.92
0.92
0.92
Most Negatively Correlated Segments
nucA
S1212
recO
S868
deaD
ypfB
S1583
ymzC
S890
yqgU
-0.45
-0.44
-0.44
-0.43
-0.43
-0.43
-0.43
-0.43
-0.42
-0.42
Expression Profile of Segment csbC
Show/Hide
Annotation of Gene csbC
Show/Hide
function
16.1: Circulate
inference
ab initio prediction:AMIGene:2.0
codon_start
1
product
putative sugar transporter
transl_table
11
note
Evidence 3: Function proposed based on presence of conserved amino acid motif, structural feature or limited homology; PubMedId: 10376822, 15849754, 16850406; Product type pt: putative transporter
db_xref
GI:2636527
protein_id
CAB16017.1
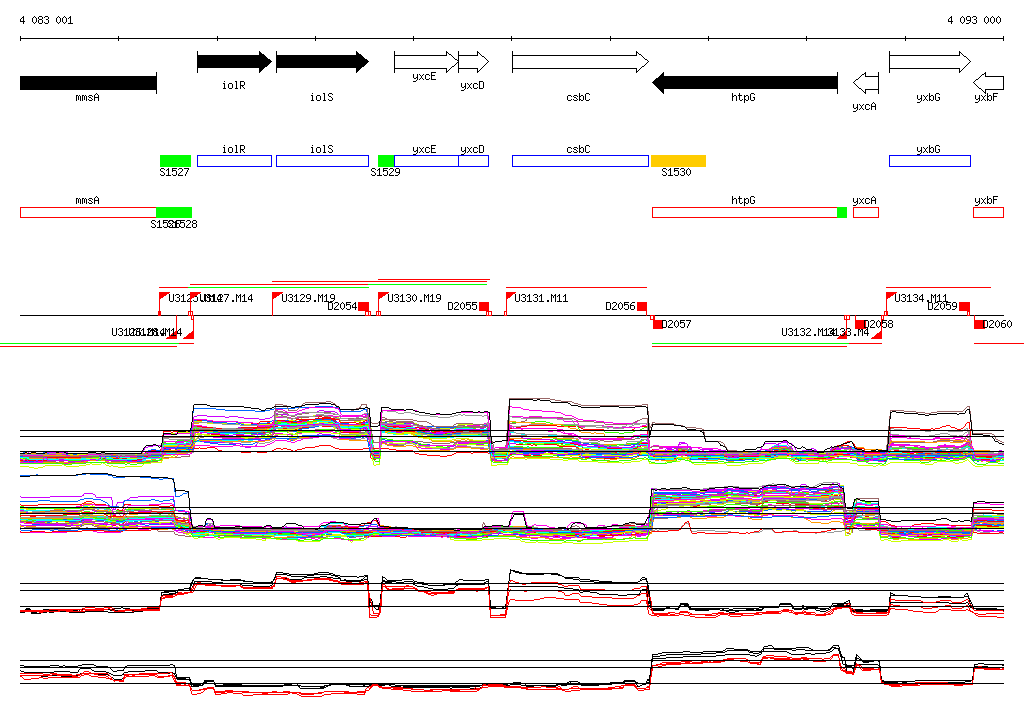
Genomic View of Gene/Segment csbC
Show/Hide
(Legend)
Browse Genome Context