| Start Page |
|
 |
| Start Page |
|
|
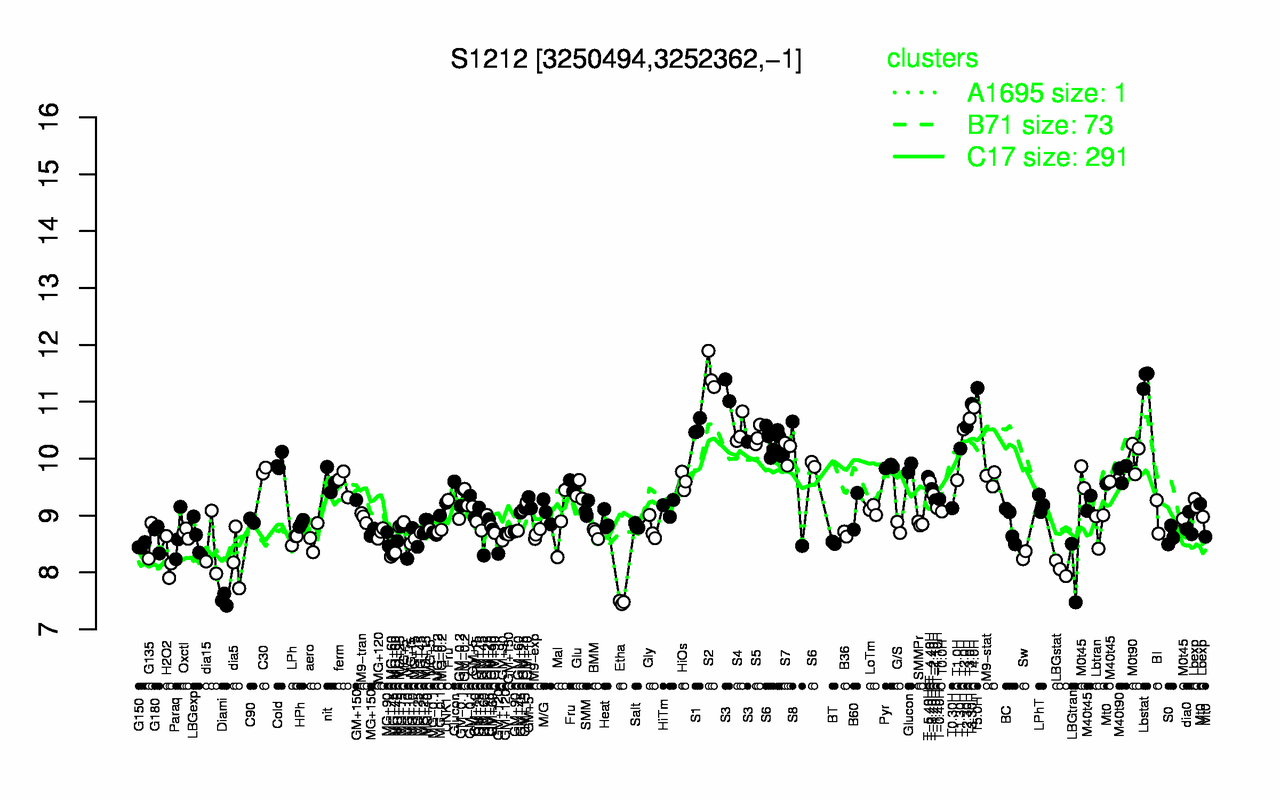
| S2 | Lbstat | T5.0H | T3.30H | S3 | T4.0H | T3.0H | T2.30H | S1 | T2.0H |
| 11.5 | 11.4 | 11.2 | 11 | 10.9 | 10.9 | 10.7 | 10.6 | 10.6 | 10.5 |
| Etha | Diami | LBGtran | LBGstat | H2O2 | dia5 | Sw | MG+60 | dia15 | G150 |
| 7.47 | 7.52 | 7.99 | 8.07 | 8.23 | 8.24 | 8.3 | 8.31 | 8.42 | 8.47 |