| Start Page |
|
 |
| Start Page |
|
|
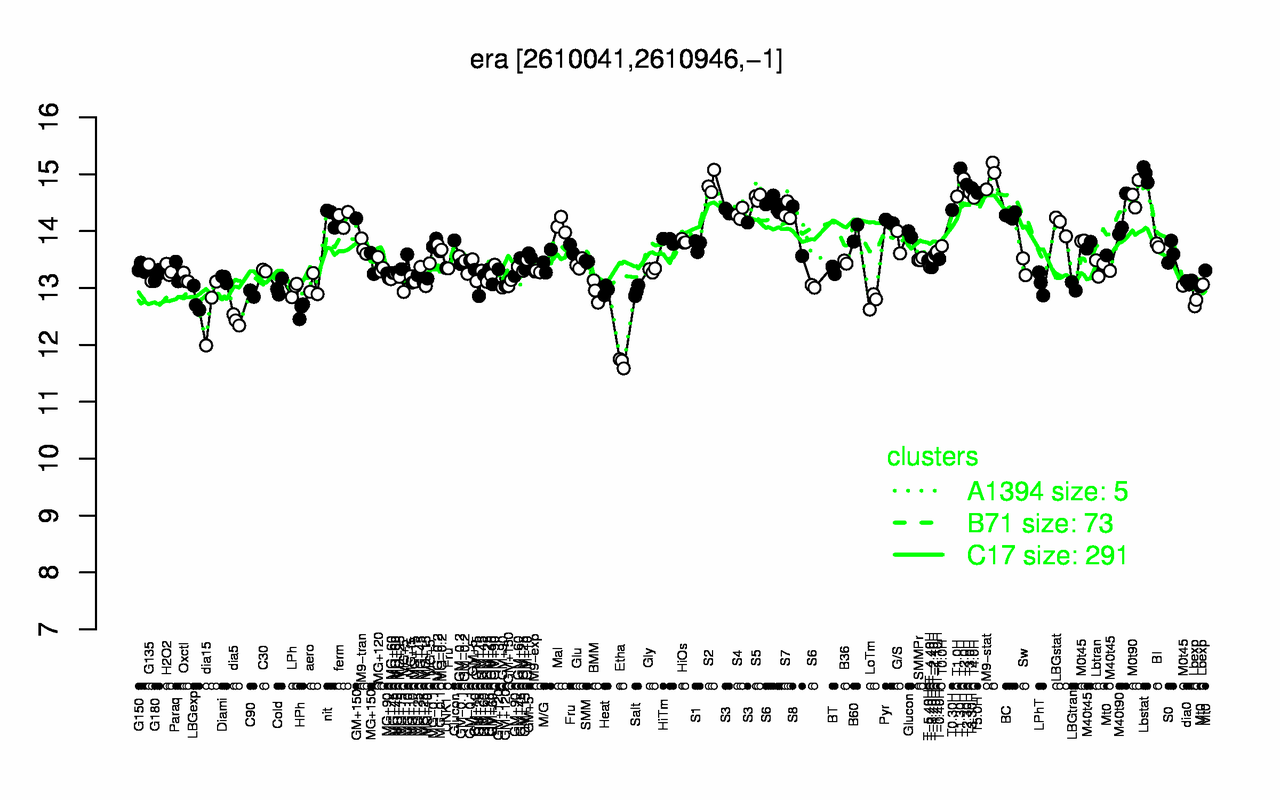
| T1.30H | Lbstat | M9-stat | T2.0H | S2 | T2.30H | T3.30H | T3.0H | T5.0H | M0t90 |
| 15.1 | 15 | 15 | 14.9 | 14.8 | 14.8 | 14.8 | 14.7 | 14.7 | 14.7 |
| Etha | dia5 | HPh | dia15 | LoTm | LBGexp | Lbexp | C90 | BMM | Salt |
| 11.7 | 12.4 | 12.6 | 12.6 | 12.8 | 12.8 | 12.8 | 12.9 | 12.9 | 12.9 |