B. subtilis Expression Data Browser
Details about S957 Show/Hide
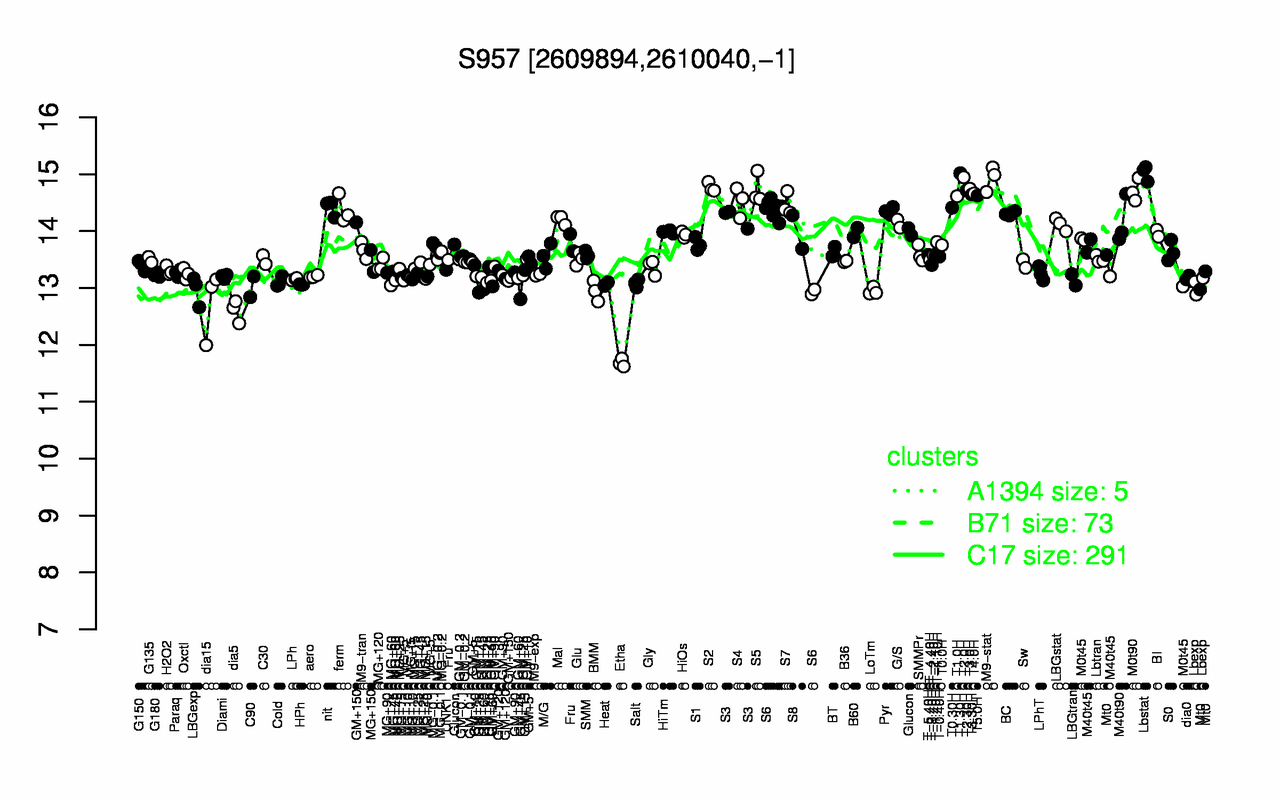
Highest Expression Conditions
Lbstat T1.30H T2.0H M9-stat S2 T3.0H S5 M0t90 T2.30H T4.0H
15 15 14.9 14.9 14.8 14.7 14.7 14.7 14.7 14.7
Lowest Expression Conditions
Etha dia5 dia15 BMM LoTm LBGexp C90 GM+45 Lbexp GM+60
11.7 12.6 12.7 12.9 12.9 13 13 13 13.1 13.1
Most Positively Correlated Segments
era yqzL cdd recO ctaC ctaE ctaF ctaD ctaG S544
0.97 0.95 0.94 0.94 0.83 0.82 0.82 0.82 0.82 0.81
Most Negatively Correlated Segments
S364 ohrA yxeH yocJ yjqA ykhA yoxD yclA S266 rtpA
-0.74 -0.73 -0.72 -0.72 -0.7 -0.69 -0.69 -0.69 -0.69 -0.69
Expression Profile of Segment S957 Show/Hide
Genomic View of Gene/Segment S957 Show/Hide
(Legend)