| Start Page |
|
 |
| Start Page |
|
|
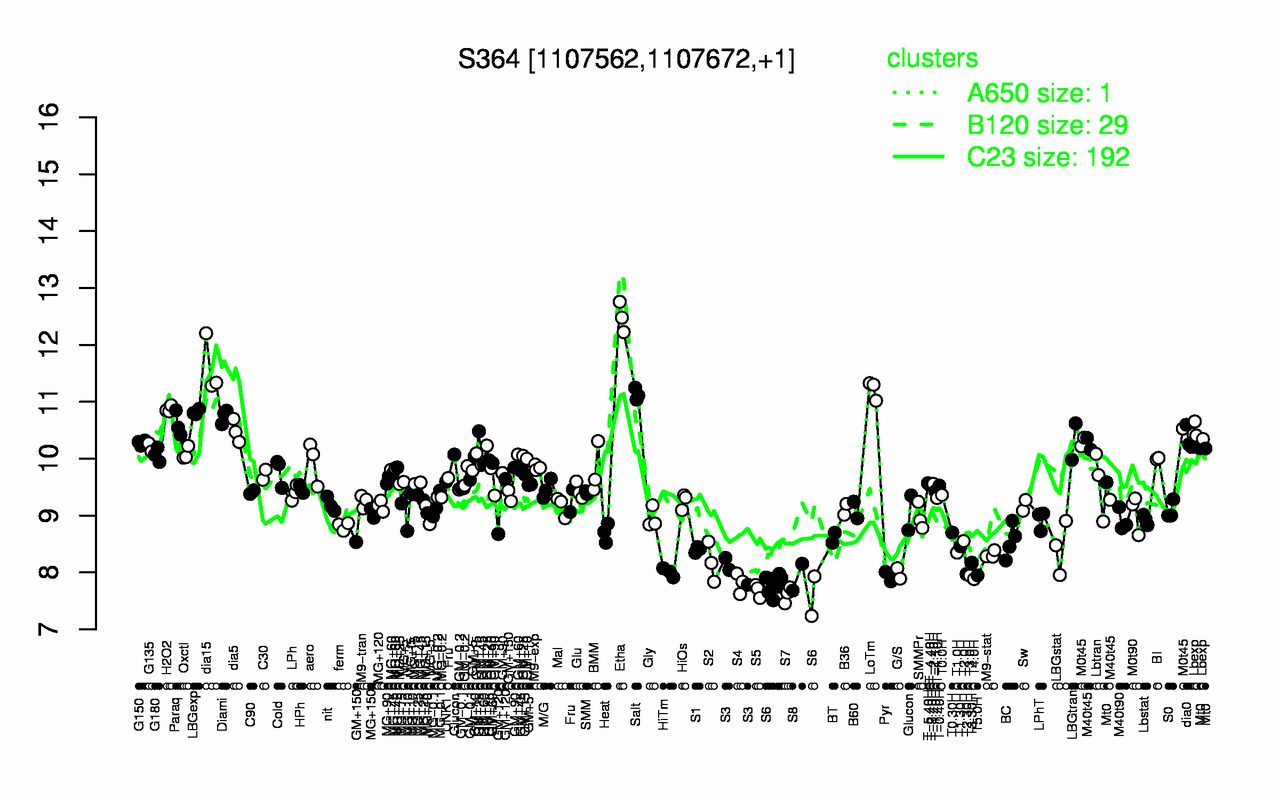
| Etha | dia15 | LoTm | Salt | H2O2 | LBGexp | Diami | Paraq | dia5 | Lbexp |
| 12.5 | 11.6 | 11.2 | 11.1 | 10.9 | 10.8 | 10.7 | 10.6 | 10.5 | 10.5 |
| S7 | S5 | S6 | S4 | T4.0H | S8 | T3.0H | T5.0H | Pyr | T2.30H |
| 7.61 | 7.68 | 7.75 | 7.81 | 7.88 | 7.92 | 7.94 | 7.95 | 7.95 | 7.97 |