B. subtilis Expression Data Browser
Start Page
B. subtilis Expression Data Browser
Gene/Segment:
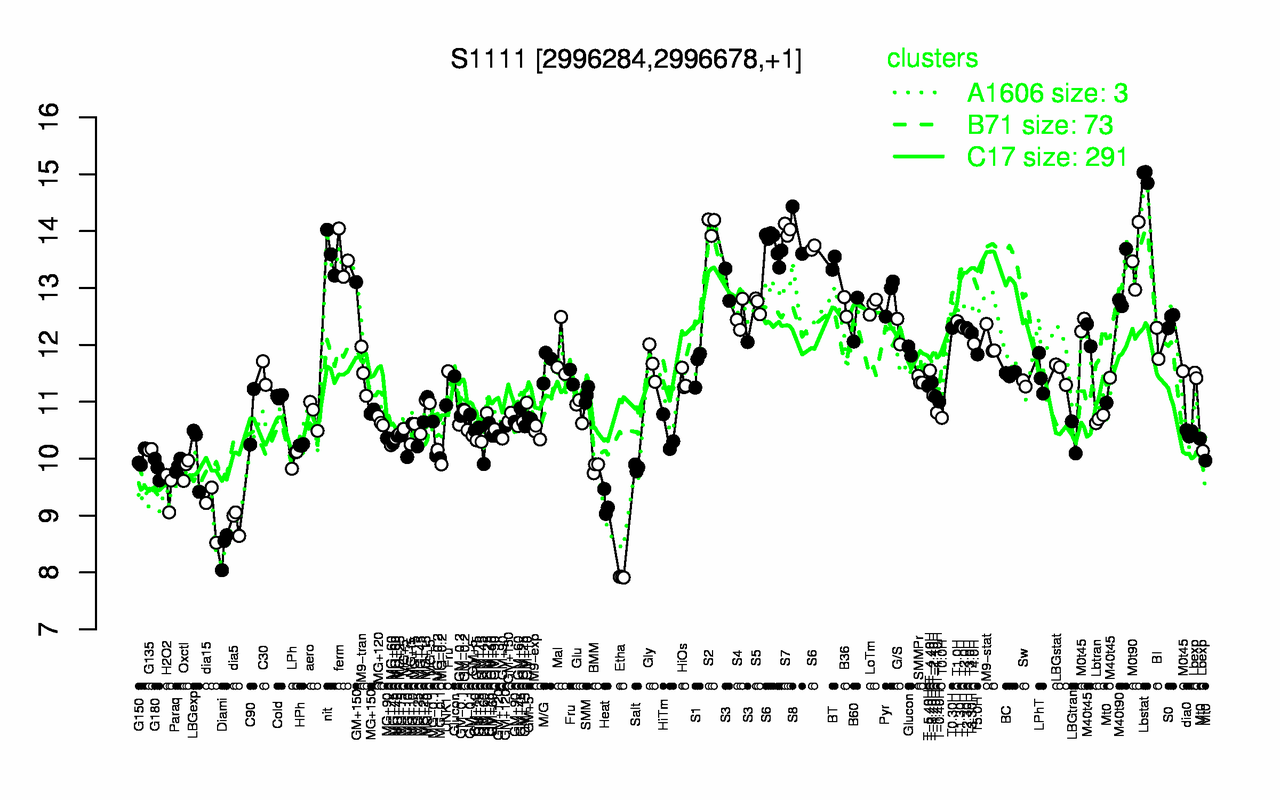
S1111
Locus Tag:
new_2996284_2996678
Details about S1111
Show/Hide
Highest Expression Conditions
Lbstat
S2
S7
S8
S6
nit
ferm
M0t90
BT
M40t90
15
14.1
14
14
13.7
13.6
13.6
13.5
13.4
13.1
Lowest Expression Conditions
Etha
Diami
dia5
dia15
Heat
H2O2
G180
Oxctl
Salt
BMM
7.92
8.42
8.9
9.08
9.21
9.46
9.82
9.83
9.84
9.85
Most Positively Correlated Segments
S1112
ctaG
ctaF
S1110
ctaE
ctaC
ytzJ
ctaD
ytpI
yqzL
0.88
0.87
0.87
0.86
0.86
0.85
0.85
0.85
0.84
0.82
Most Negatively Correlated Segments
nrnA
ydeP
S185
pdxK
yclA
S113
yuaC
ycgK
ycgR
yxeH
-0.86
-0.82
-0.81
-0.79
-0.77
-0.77
-0.77
-0.77
-0.77
-0.77
Expression Profile of Segment S1111
Show/Hide
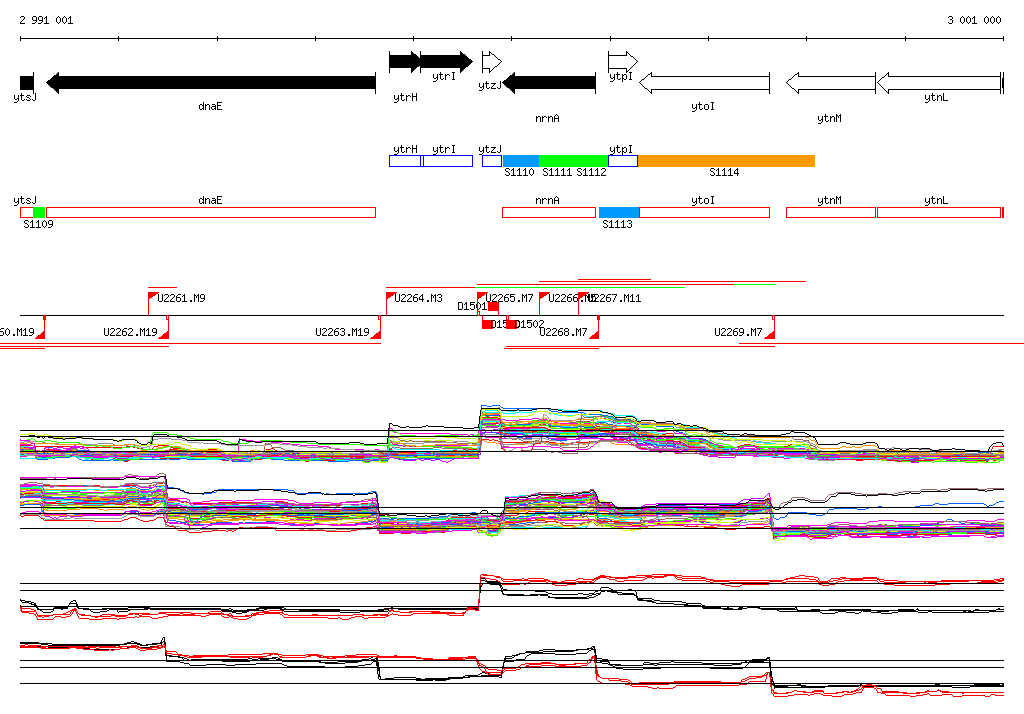
Genomic View of Gene/Segment S1111
Show/Hide
(Legend)
Browse Genome Context