B. subtilis Expression Data Browser
Start Page
B. subtilis Expression Data Browser
Gene/Segment:
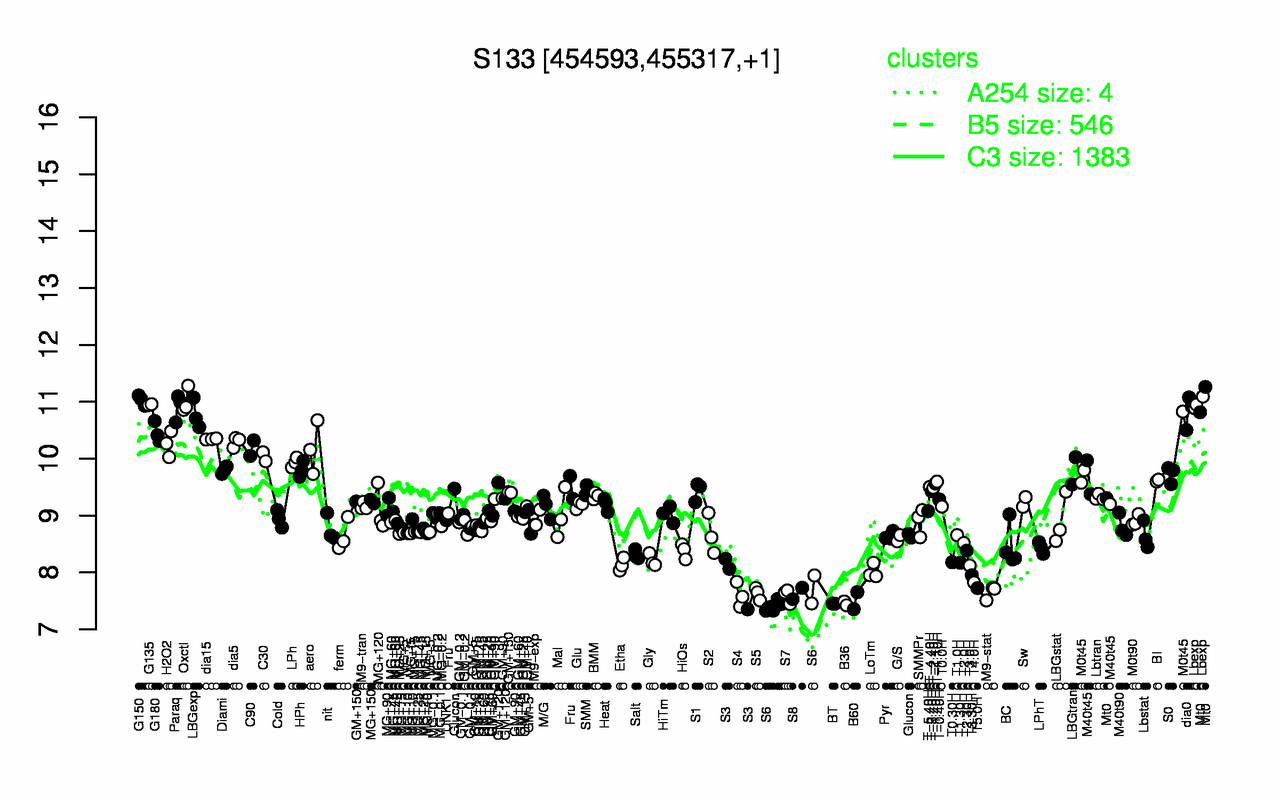
S133
Locus Tag:
new_454593_455317
Details about S133
Show/Hide
Highest Expression Conditions
G150
Oxctl
Lbexp
G135
Paraq
dia0
LBGexp
Mt0
G180
dia15
11
11
11
11
10.9
10.8
10.8
10.5
10.5
10.3
Lowest Expression Conditions
BT
B36
S6
B60
S7
S4
S5
S8
M9-stat
T5.0H
7.45
7.46
7.48
7.5
7.59
7.6
7.63
7.63
7.65
7.73
Most Positively Correlated Segments
sipU
yybC
smc
mmr
spcB
S550
yhcI
S143
ycgQ
yhcG
0.88
0.87
0.84
0.84
0.84
0.84
0.84
0.83
0.83
0.83
Most Negatively Correlated Segments
mpr
yhzC
ybfJ
yhdT
dat
S333
ykwB
spoIIAB
sigF
rapA
-0.86
-0.85
-0.84
-0.84
-0.81
-0.81
-0.8
-0.79
-0.79
-0.78
Expression Profile of Segment S133
Show/Hide
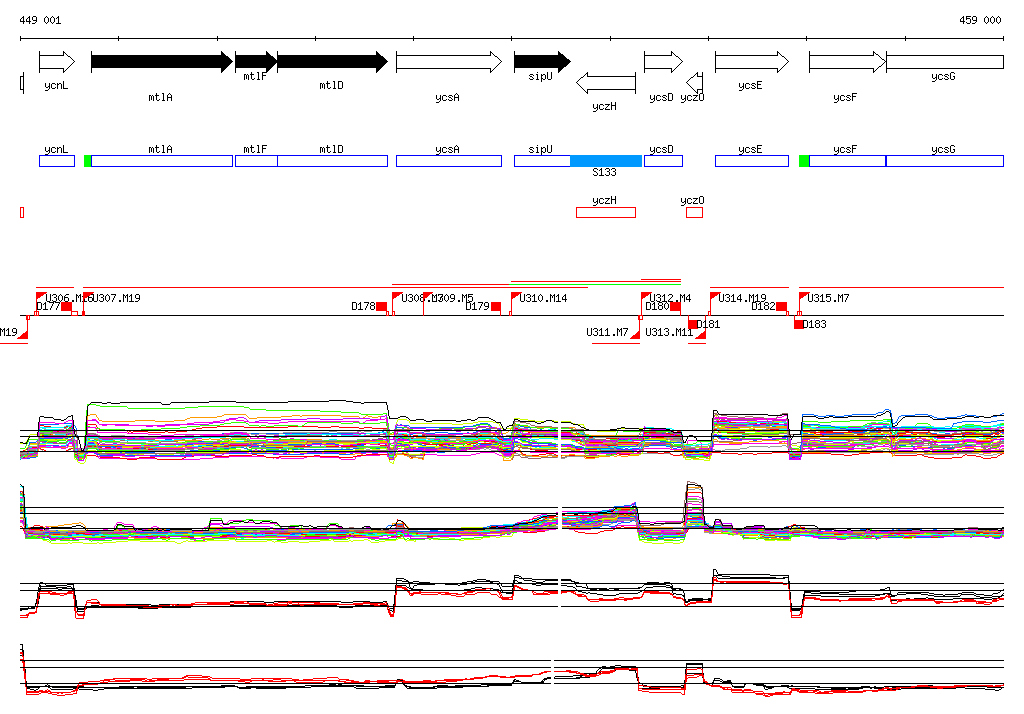
Genomic View of Gene/Segment S133
Show/Hide
(Legend)
Browse Genome Context