B. subtilis Expression Data Browser
Start Page
B. subtilis Expression Data Browser
Gene/Segment:
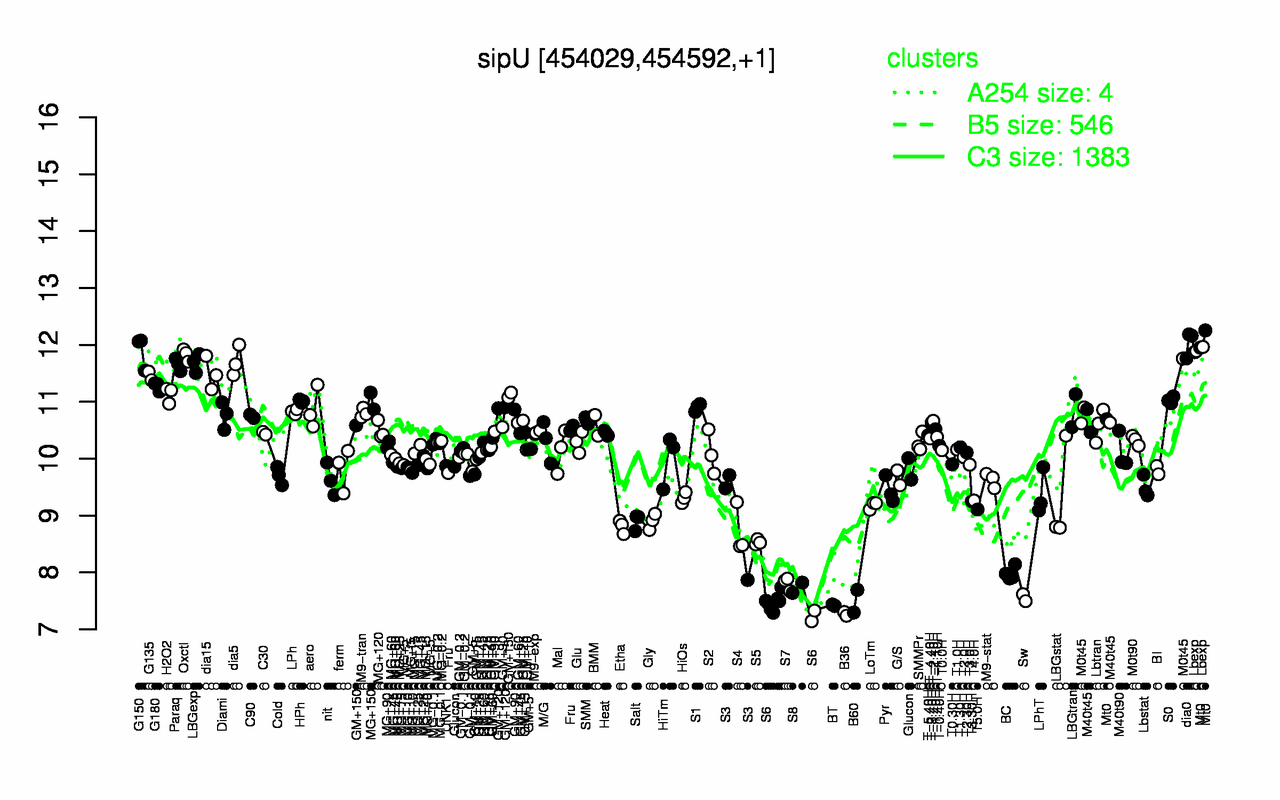
sipU
Locus Tag:
BSU04010
Details about sipU
Show/Hide
Highest Expression Conditions
dia0
Lbexp
G150
Oxctl
dia5
LBGexp
Paraq
Mt0
dia15
G135
12
11.9
11.9
11.8
11.7
11.7
11.7
11.6
11.5
11.5
Lowest Expression Conditions
B36
BT
S6
B60
Sw
S8
S7
BC
S5
S4
7.27
7.42
7.43
7.49
7.56
7.73
7.81
7.98
8.53
8.73
Most Positively Correlated Segments
yybG
ycbM
yokF
yvcP
S133
S237
S298
ylbH
yvzF
yfjM
0.89
0.89
0.88
0.88
0.88
0.88
0.87
0.87
0.86
0.86
Most Negatively Correlated Segments
ybfJ
mpr
S458
yoyB
S738
yhcM
yknV
ynzL
yocN
S1136
-0.83
-0.83
-0.79
-0.77
-0.77
-0.77
-0.76
-0.76
-0.76
-0.75
Expression Profile of Segment sipU
Show/Hide
Annotation of Gene sipU
Show/Hide
function
16.1: Circulate
function
16.2: Construct biomass (Anabolism)
function
16.6: Maintain
inference
ab initio prediction:AMIGene:2.0
codon_start
1
EC_number
3.4.21.89
transl_table
11
note
Evidence 1a: Function experimentally demonstrated in the studied strain; PubMedId: 14568161, 9325333; Product type e: enzyme
db_xref
GI:2632702
product
type I signal peptidase
protein_id
CAB12209.1
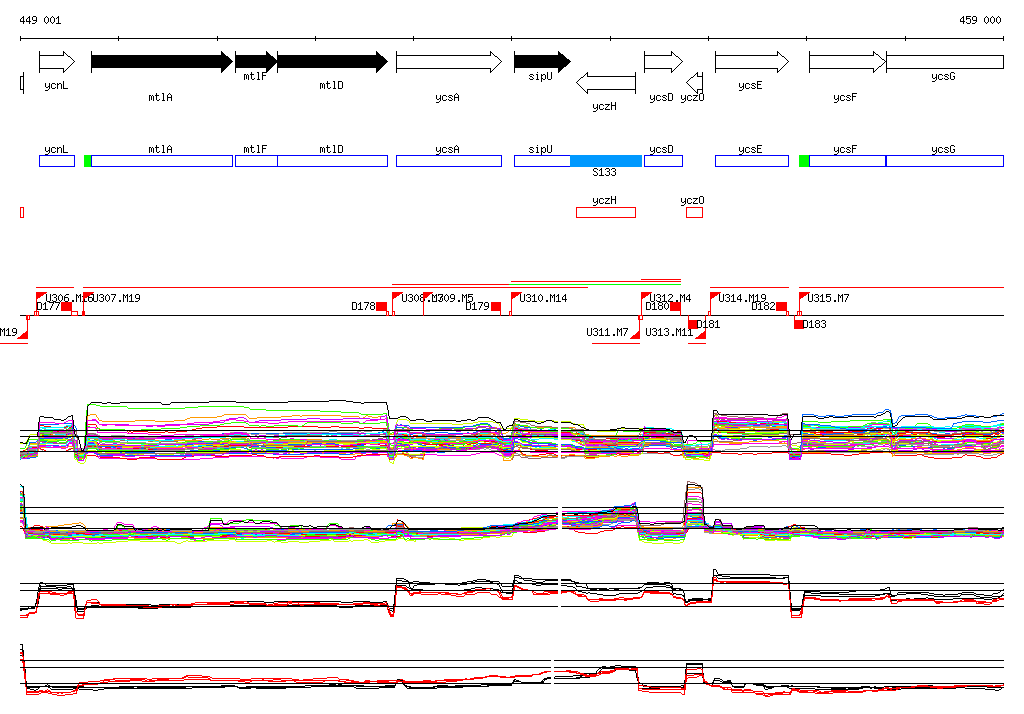
Genomic View of Gene/Segment sipU
Show/Hide
(Legend)
Browse Genome Context