| Start Page |
|
 |
| Start Page |
|
|
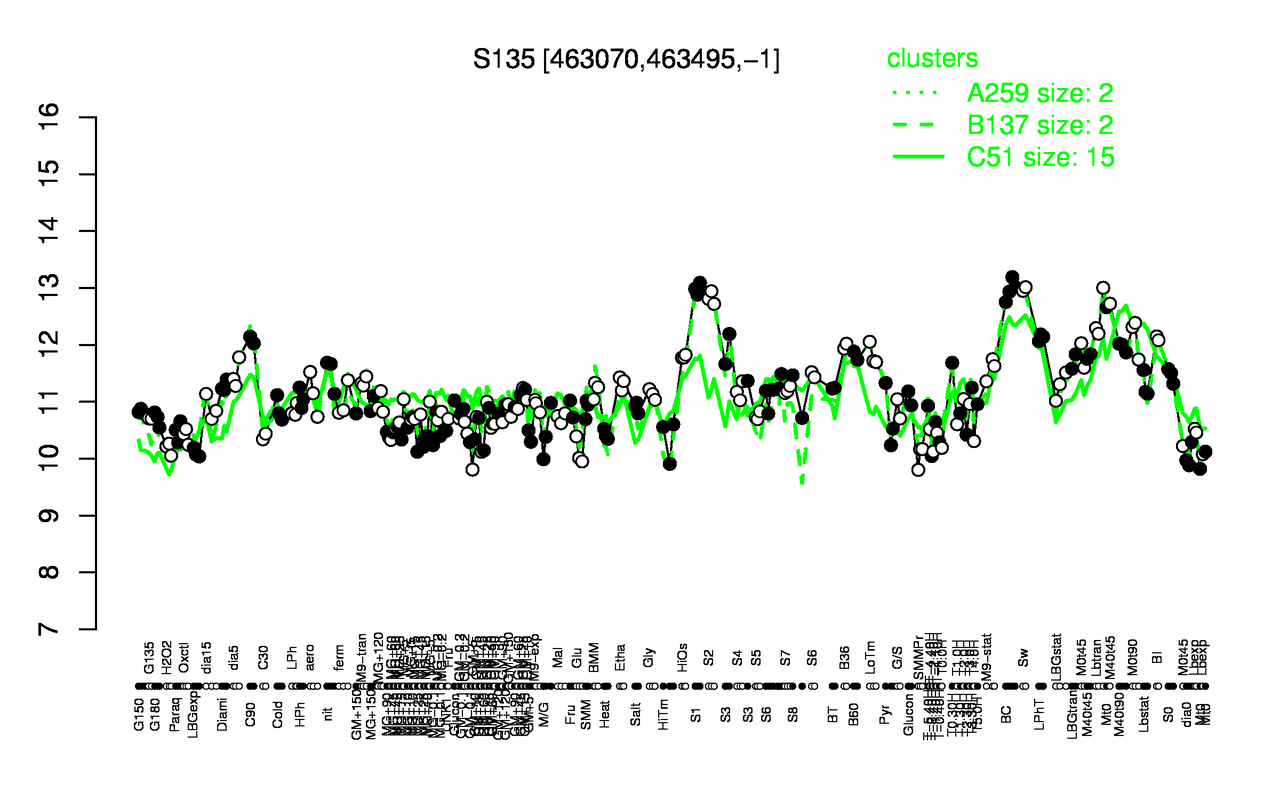
| S1 | Sw | BC | S2 | Lbtran | M0t90 | LPhT | BI | M40t45 | C90 |
| 13 | 13 | 13 | 12.8 | 12.5 | 12.1 | 12.1 | 12.1 | 12.1 | 12.1 |
| SMMPr | T-3.40H | dia0 | LBGexp | Glu | T-2.40H | H2O2 | T0.0H | GM+5 | T-0.40H |
| 10 | 10 | 10 | 10.1 | 10.1 | 10.1 | 10.2 | 10.2 | 10.2 | 10.3 |