| Start Page |
|
 |
| Start Page |
|
|
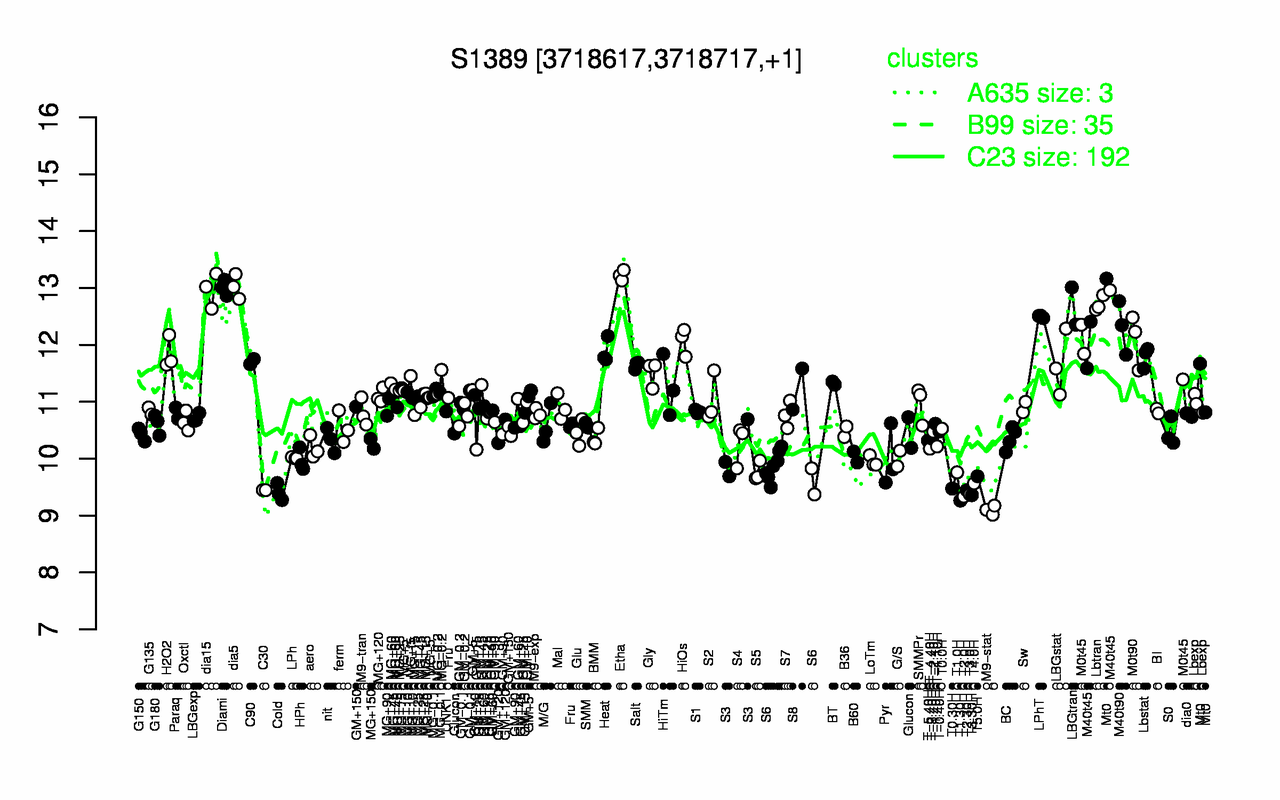
| Etha | dia5 | Diami | dia15 | Lbtran | LBGtran | LPhT | M40t45 | M40t90 | M0t90 |
| 13.2 | 13 | 13 | 13 | 12.7 | 12.7 | 12.5 | 12.3 | 12.3 | 12.1 |
| M9-stat | T1.30H | T2.0H | T3.30H | T3.0H | Cold | T2.30H | C30 | T0.30H | T4.0H |
| 9.1 | 9.26 | 9.33 | 9.36 | 9.37 | 9.41 | 9.44 | 9.45 | 9.47 | 9.57 |