| Start Page |
|
 |
| Start Page |
|
|
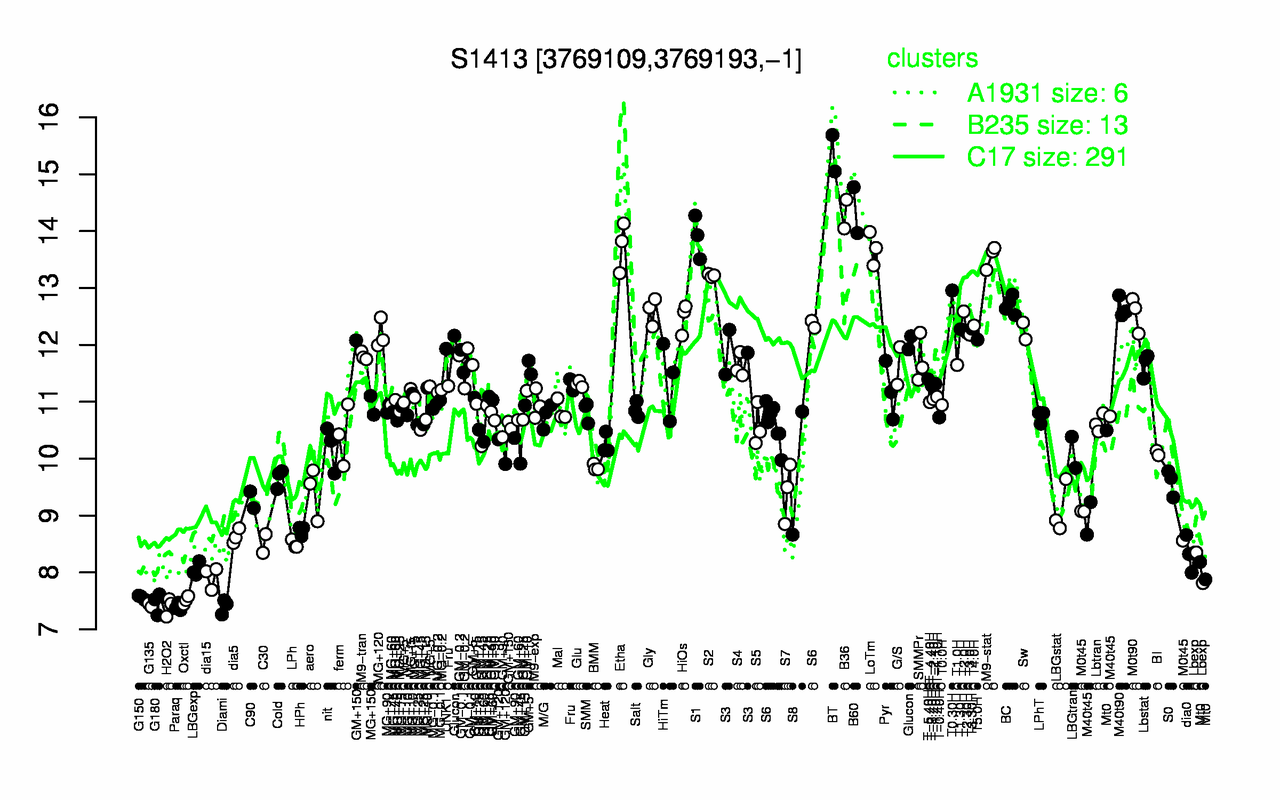
| BT | B60 | B36 | S1 | Etha | LoTm | M9-stat | S2 | T0.30H | BC |
| 15.4 | 14.4 | 14.3 | 13.9 | 13.7 | 13.7 | 13.6 | 13.2 | 13 | 12.7 |
| Paraq | H2O2 | Diami | G135 | G180 | Oxctl | G150 | dia15 | LBGexp | Lbexp |
| 7.39 | 7.4 | 7.41 | 7.43 | 7.46 | 7.51 | 7.56 | 7.92 | 8.05 | 8.17 |