B. subtilis Expression Data Browser
Details about S146 Show/Hide
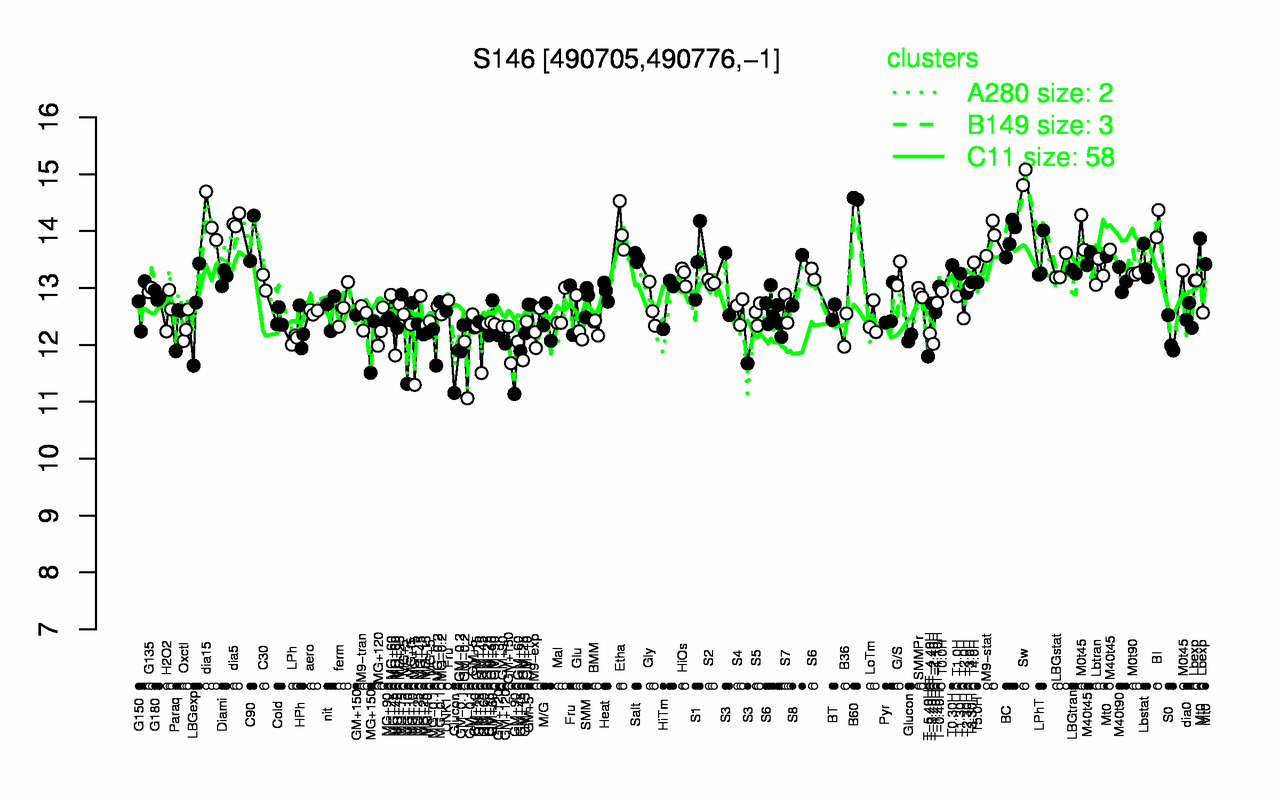
Highest Expression Conditions
Sw B60 dia15 dia5 BI Etha BC M9-stat C90 M0t45
14.9 14.6 14.2 14.2 14.1 14 13.9 13.9 13.9 13.8
Lowest Expression Conditions
GM-0.2 T-5.40H Glucon GM+45 GM+90 MG+150 T-2.40H MG+10 GM+120 LPh
11.7 11.8 11.8 11.9 11.9 12 12 12.1 12.1 12.1
Most Positively Correlated Segments
ydzK yneJ S987 tatCY clpC spxA S988 mcsB S485 tatAY
0.83 0.68 0.63 0.62 0.62 0.61 0.6 0.6 0.6 0.6
Most Negatively Correlated Segments
lysP bioI nadC natA bioB S1154 bioYB nadB opuAC bioD
-0.62 -0.57 -0.57 -0.57 -0.56 -0.56 -0.56 -0.56 -0.56 -0.55
Expression Profile of Segment S146 Show/Hide
Genomic View of Gene/Segment S146 Show/Hide
(Legend)