| Start Page |
|
 |
| Start Page |
|
|
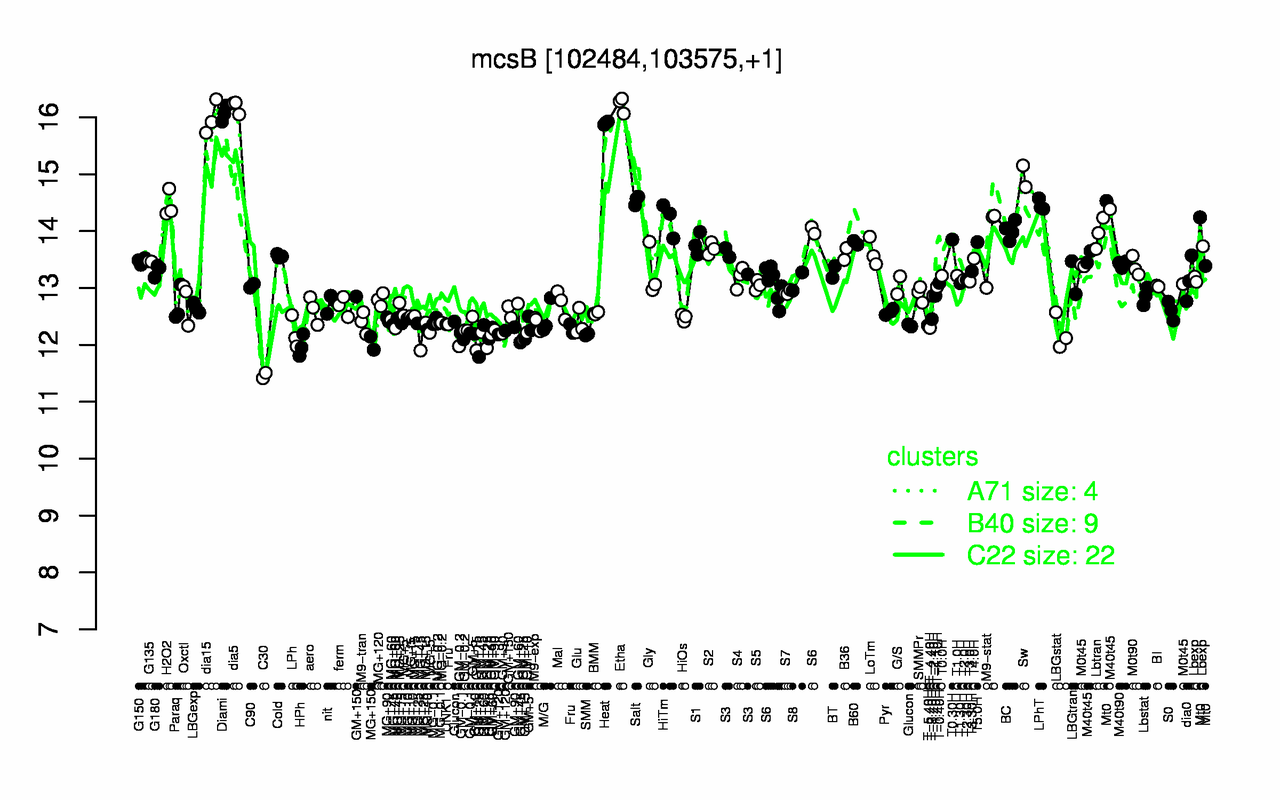
| Etha | dia5 | Diami | dia15 | Heat | Sw | Salt | H2O2 | LPhT | HiTm |
| 16.2 | 16.2 | 16.1 | 16 | 15.9 | 15 | 14.5 | 14.5 | 14.5 | 14.2 |
| C30 | GM+25 | HPh | MG+150 | GM+15 | GM+45 | GM-0.2 | GM-0.1 | SMM | GM+10 |
| 11.5 | 11.9 | 12 | 12 | 12 | 12.1 | 12.2 | 12.2 | 12.2 | 12.2 |