| Start Page |
|
 |
| Start Page |
|
|
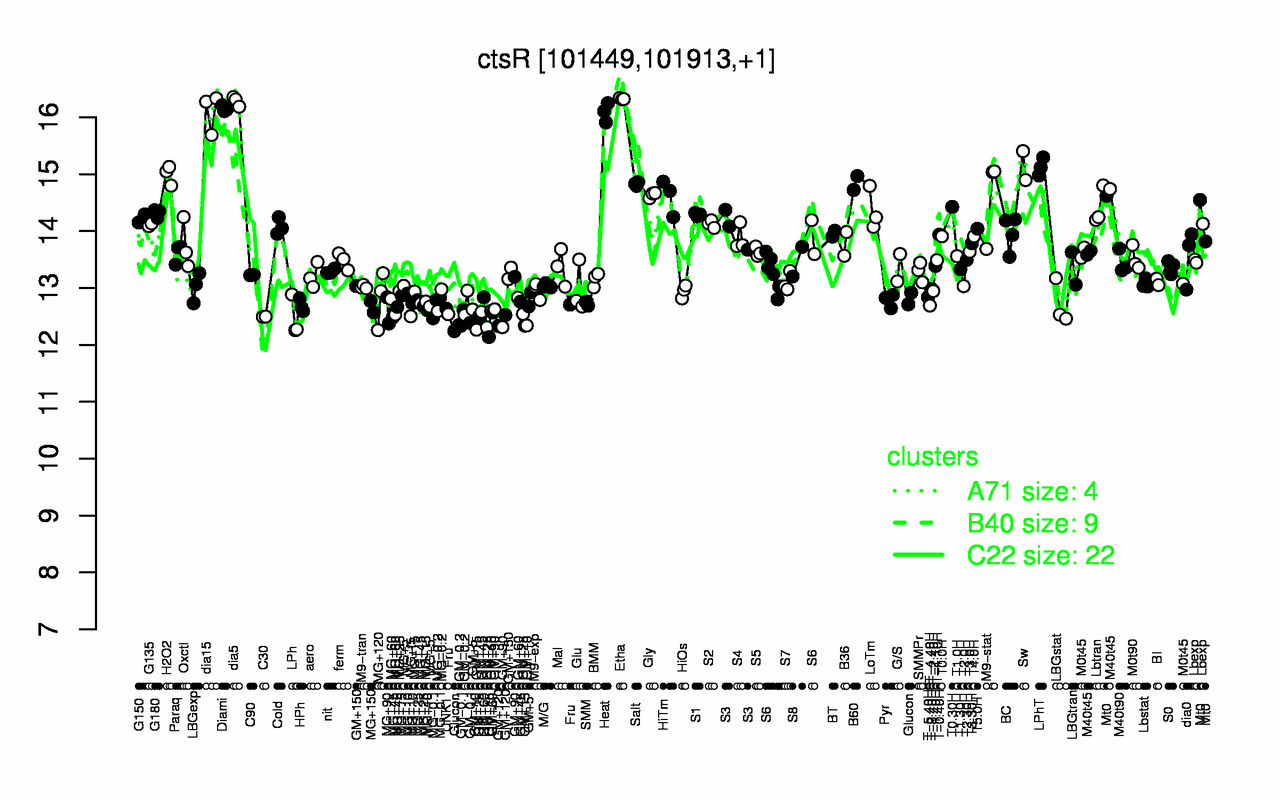
| Etha | dia5 | Diami | dia15 | Heat | Sw | LPhT | H2O2 | B60 | Salt |
| 16.3 | 16.3 | 16.2 | 16.1 | 16.1 | 15.2 | 15.1 | 15 | 14.8 | 14.8 |
| GM+15 | GM+10 | GM+120 | GM-0.1 | GM+25 | LPh | C30 | MG+t5 | MG+90 | GM-0.2 |
| 12.2 | 12.4 | 12.4 | 12.4 | 12.5 | 12.5 | 12.5 | 12.5 | 12.6 | 12.6 |