| Start Page |
|
 |
| Start Page |
|
|
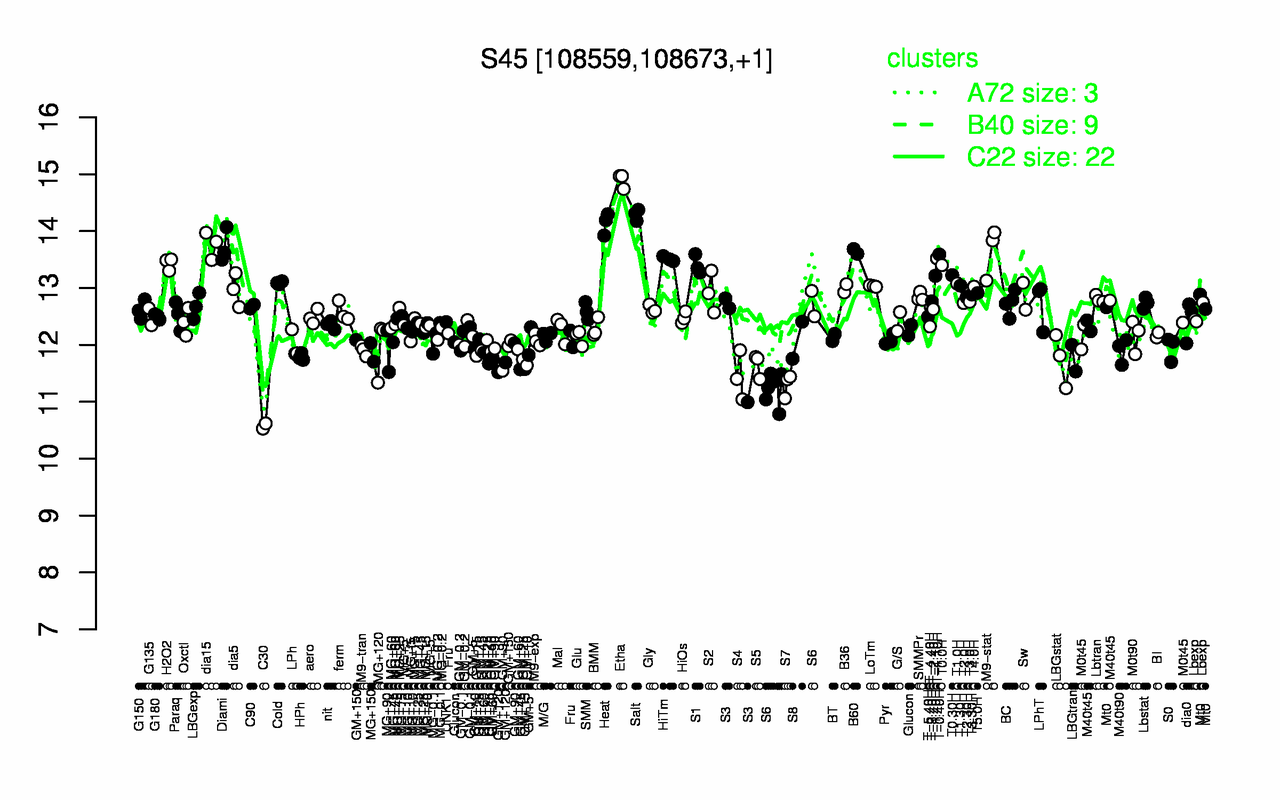
| Etha | Salt | Heat | dia15 | Diami | M9-stat | B60 | T-0.40H | T-1.10H | HiTm |
| 14.9 | 14.3 | 14.1 | 13.8 | 13.7 | 13.6 | 13.6 | 13.6 | 13.5 | 13.5 |
| C30 | S7 | S4 | S6 | GM+120 | S5 | GM+15 | LBGstat | LBGtran | GM+10 |
| 10.6 | 11.3 | 11.4 | 11.6 | 11.6 | 11.6 | 11.7 | 11.7 | 11.8 | 11.8 |