B. subtilis Expression Data Browser
Start Page
B. subtilis Expression Data Browser
Gene/Segment:
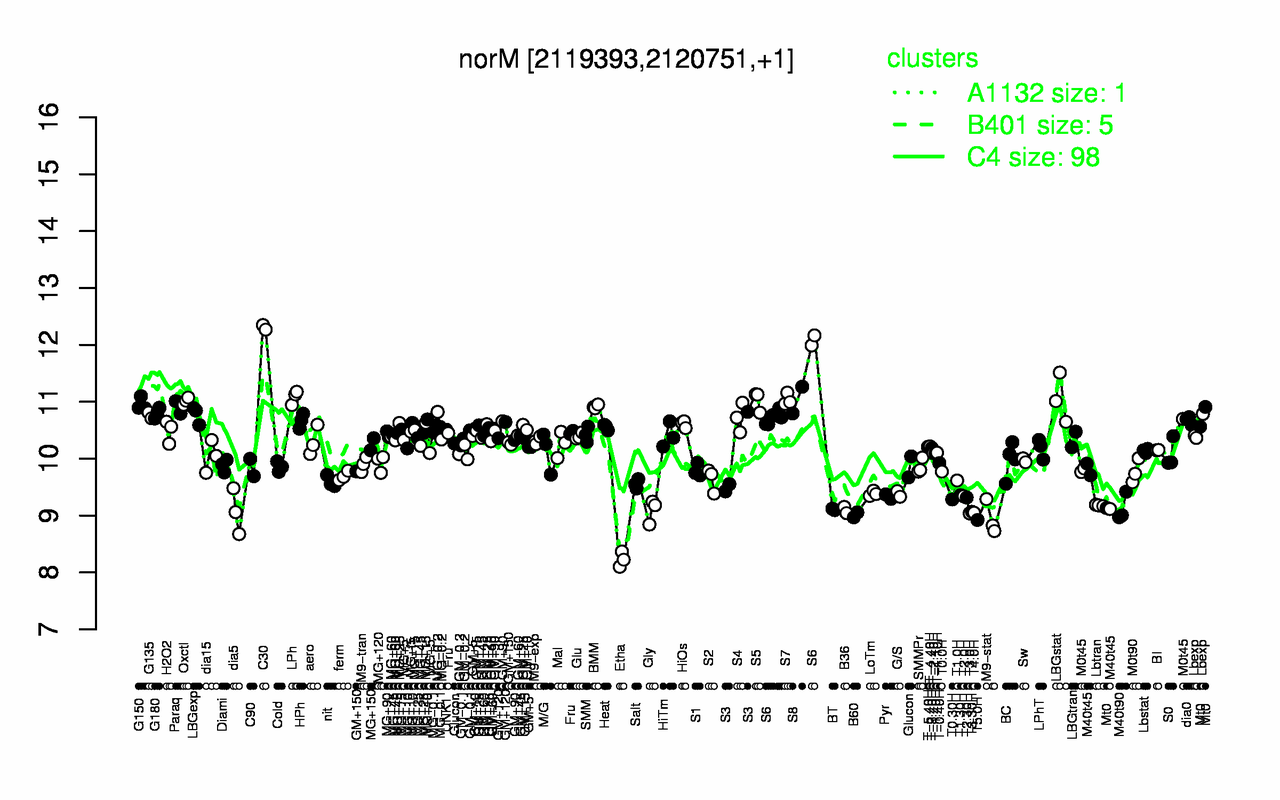
norM
Locus Tag:
BSU19440
Details about norM
Show/Hide
Highest Expression Conditions
C30
LPh
LBGstat
S7
S8
S6
S5
Oxctl
G150
Paraq
12.3
11.1
11.1
11
11
11
11
11
11
10.9
Lowest Expression Conditions
Etha
T5.0H
M9-stat
B60
T3.0H
T4.0H
T3.30H
dia5
Gly
B36
8.23
8.92
8.95
9.01
9.04
9.05
9.07
9.07
9.09
9.1
Most Positively Correlated Segments
speA
yndK
hemN
metK
ytqA
S312
yvsG
htrC
hemZ
murG
0.76
0.73
0.72
0.72
0.72
0.72
0.71
0.71
0.71
0.7
Most Negatively Correlated Segments
kinA
ypiB
spo0F
rapG
S1414
yrpD
ypiF
ytxG
S627
S234
-0.64
-0.64
-0.63
-0.63
-0.62
-0.62
-0.62
-0.62
-0.62
-0.61
Expression Profile of Segment norM
Show/Hide
Annotation of Gene norM
Show/Hide
function
16.1: Circulate
function
16.8: Protect
inference
ab initio prediction:AMIGene:2.0
codon_start
1
product
MatE Na+-driven efflux family protein
transl_table
11
note
Evidence 2a: Function of homologous gene experimentally demonstrated in an other organism; PubMedId: 14766544, 15849754, 15855508, 16850406, 16954325; Product type t: transporter
db_xref
GI:2634337
protein_id
CAB13836.1
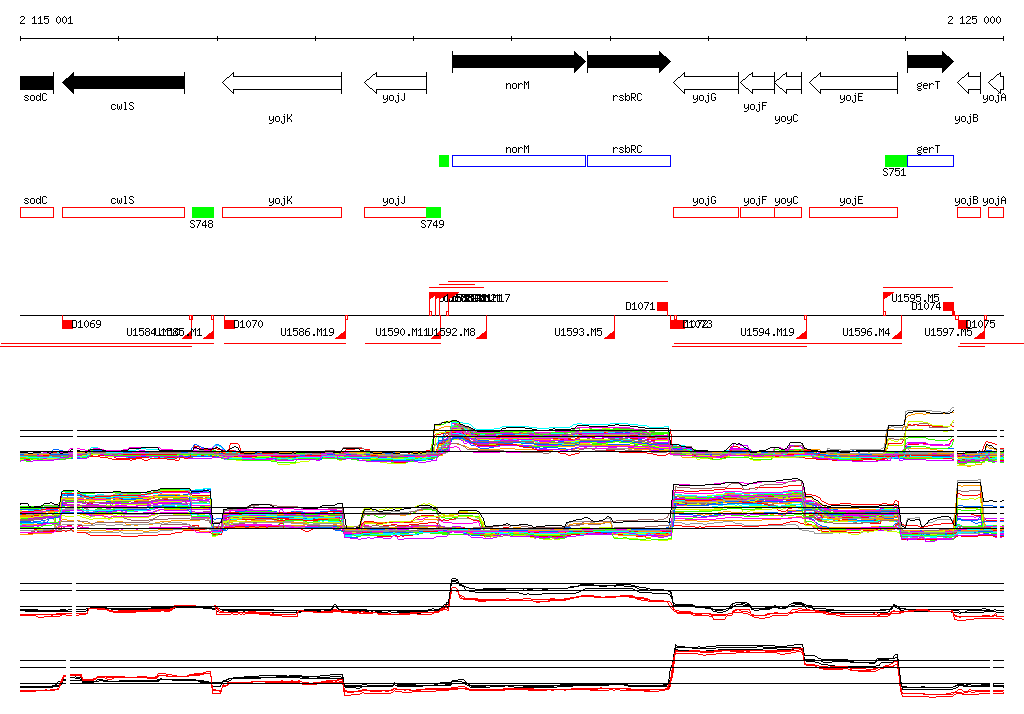
Genomic View of Gene/Segment norM
Show/Hide
(Legend)
Browse Genome Context