| Start Page |
|
 |
| Start Page |
|
|
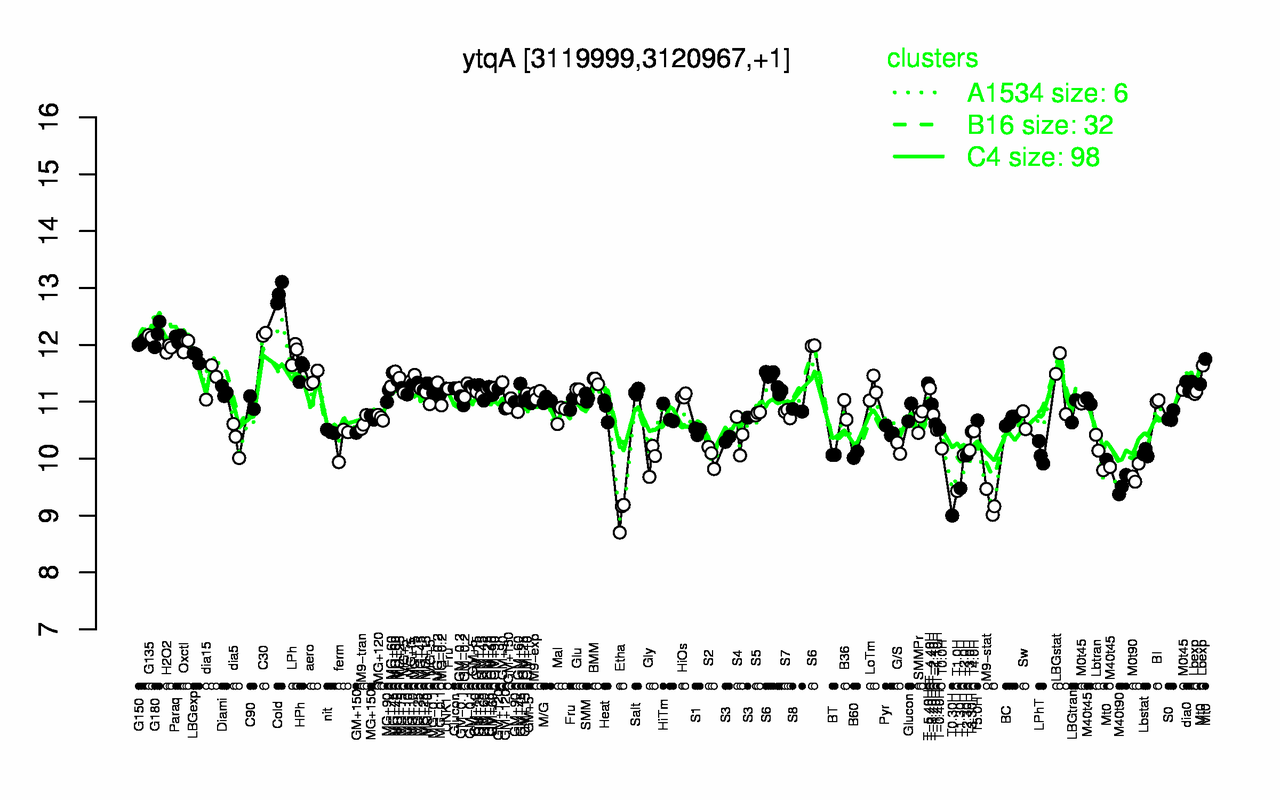
| Cold | G180 | C30 | G135 | Paraq | G150 | Oxctl | H2O2 | LPh | LBGexp |
| 12.9 | 12.2 | 12.2 | 12.2 | 12.1 | 12 | 12 | 11.9 | 11.9 | 11.8 |
| T0.30H | Etha | M9-stat | T1.0H | T1.30H | M40t90 | M0t90 | Gly | S2 | T2.30H |
| 9 | 9.02 | 9.21 | 9.43 | 9.48 | 9.53 | 9.73 | 9.98 | 10 | 10.1 |