B. subtilis Expression Data Browser
Details about S1013 Show/Hide
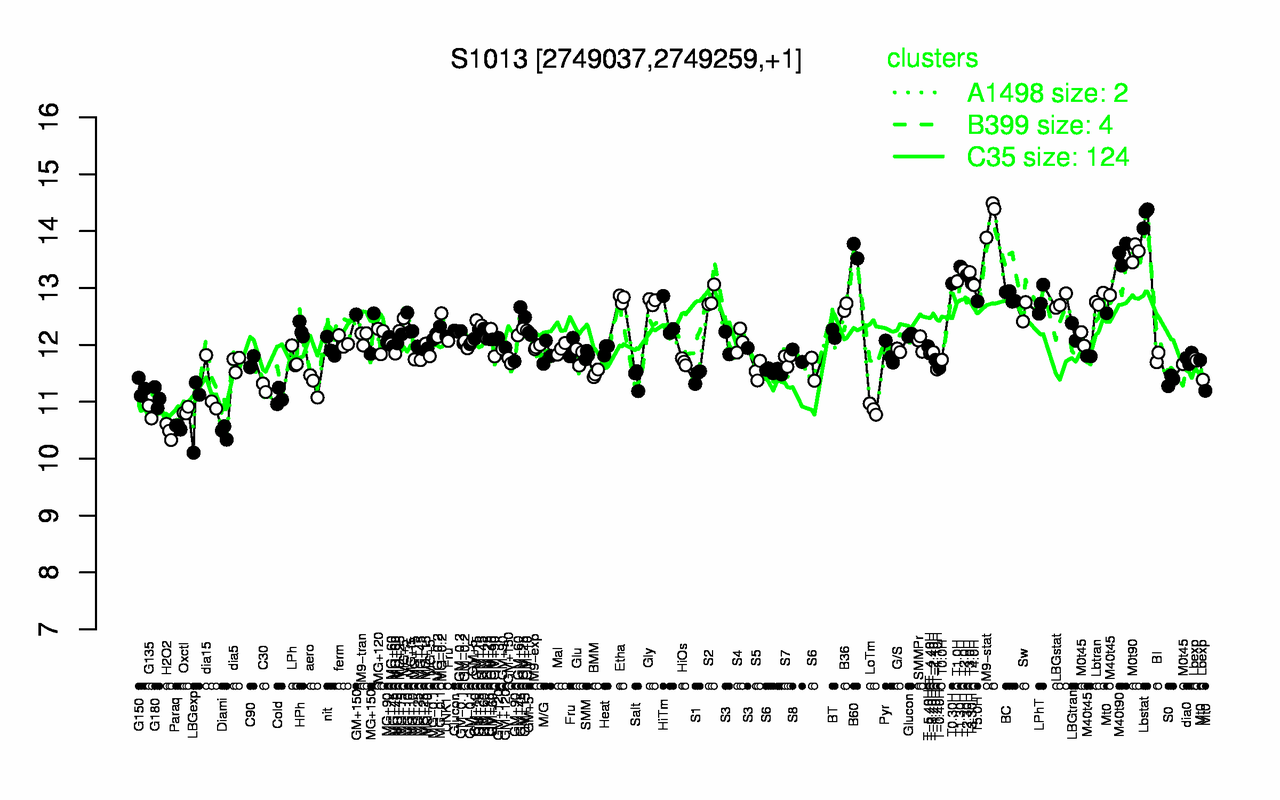
Highest Expression Conditions
Lbstat M9-stat B60 M0t90 M40t90 T1.30H T2.0H T3.0H T2.30H T1.0H
14.3 14.3 13.6 13.6 13.6 13.4 13.3 13.3 13.2 13.1
Lowest Expression Conditions
Diami H2O2 Paraq G135 Oxctl LBGexp LoTm G180 Cold dia15
10.5 10.5 10.6 10.8 10.8 10.9 10.9 11.1 11.1 11.2
Most Positively Correlated Segments
yraL yisT ydjE tatAC yncM yvyD yukJ yoxA mdxR dacC
0.98 0.76 0.76 0.74 0.72 0.7 0.69 0.69 0.68 0.68
Most Negatively Correlated Segments
yvsG ynbA ytqA murC ykuK lmrB S515 ywqB lmrA S39
-0.75 -0.73 -0.72 -0.71 -0.7 -0.7 -0.7 -0.69 -0.69 -0.69
Expression Profile of Segment S1013 Show/Hide
Genomic View of Gene/Segment S1013 Show/Hide
(Legend)