| Start Page |
|
 |
| Start Page |
|
|
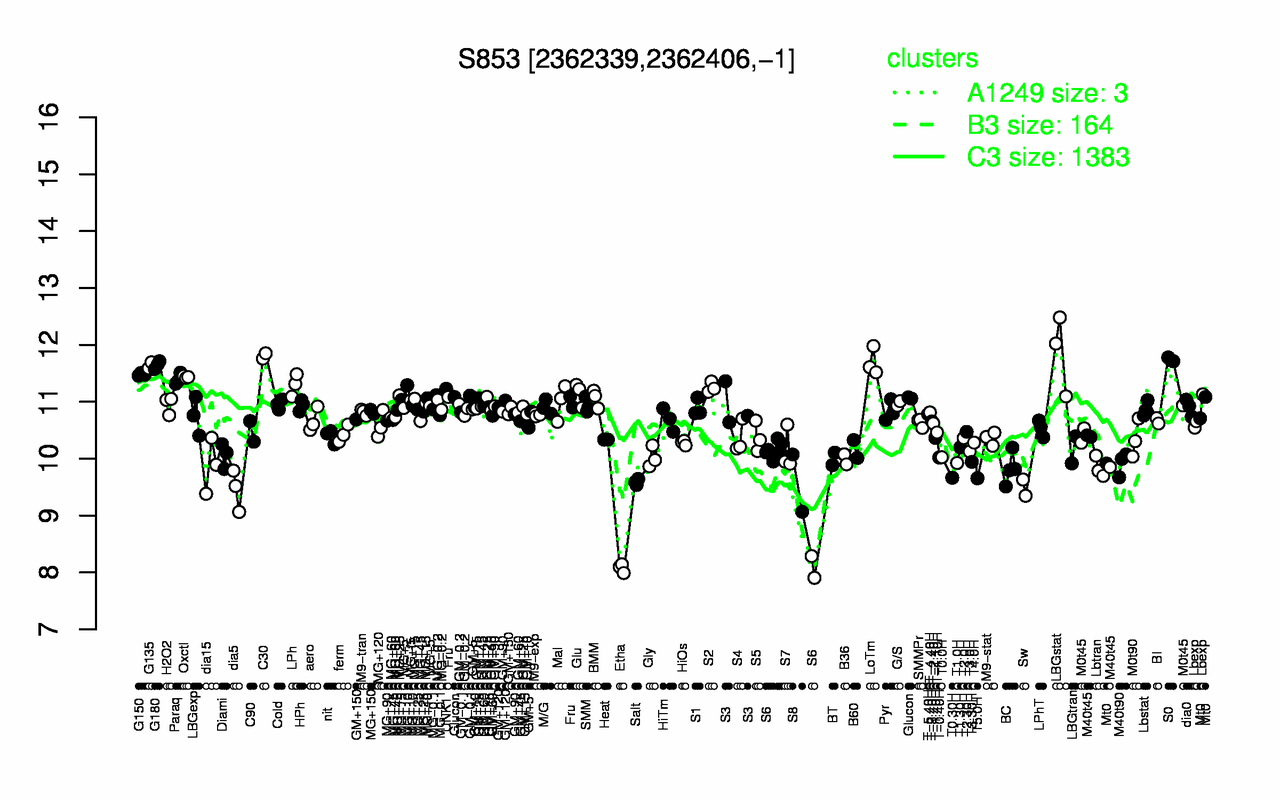
| LBGstat | C30 | S0 | LoTm | G180 | G135 | G150 | Oxctl | Paraq | LPh |
| 11.9 | 11.8 | 11.7 | 11.7 | 11.6 | 11.6 | 11.5 | 11.4 | 11.4 | 11.3 |
| Etha | dia5 | Sw | S8 | Salt | T5.0H | T0.30H | S6 | BC | Lbtran |
| 8.08 | 9.46 | 9.49 | 9.57 | 9.59 | 9.66 | 9.67 | 9.69 | 9.83 | 9.85 |