| Start Page |
|
 |
| Start Page |
|
|
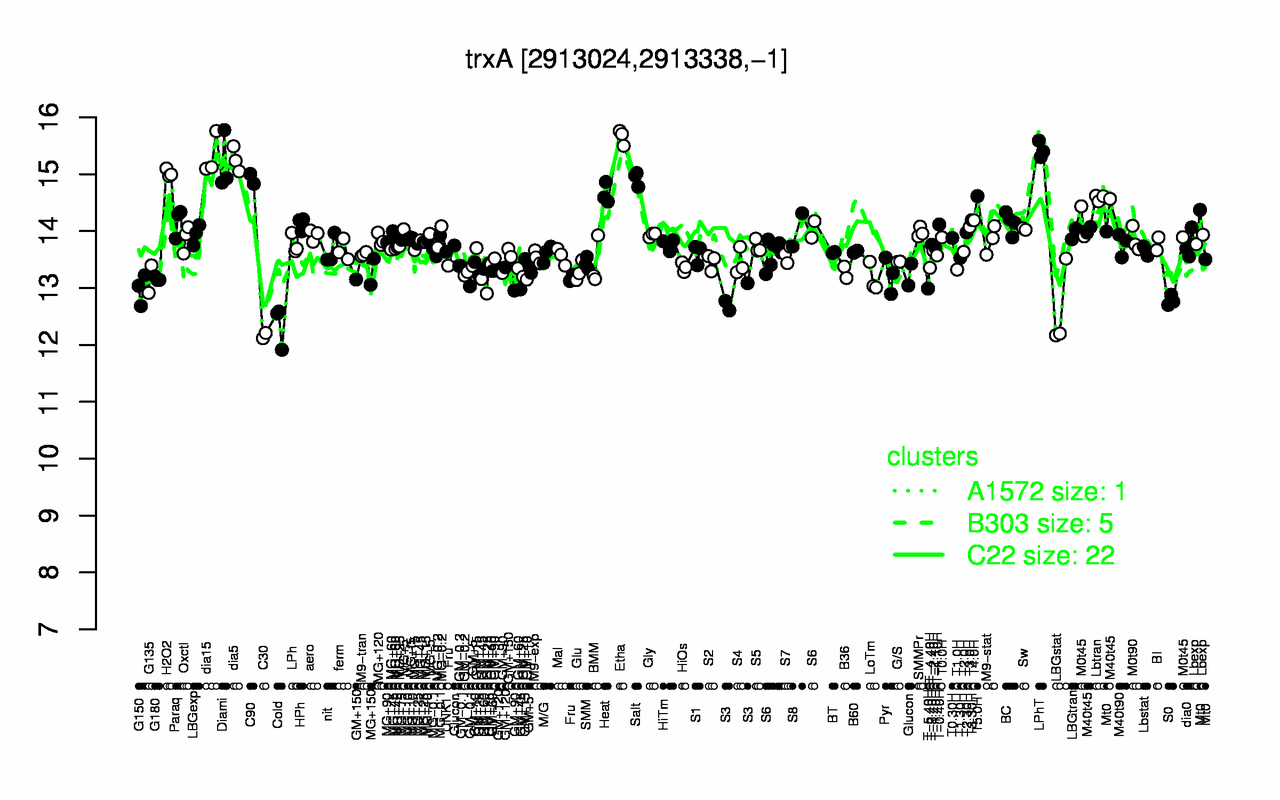
| Etha | LPhT | dia15 | dia5 | Diami | H2O2 | Salt | C90 | Heat | T5.0H |
| 15.7 | 15.4 | 15.3 | 15.3 | 15.2 | 15 | 14.9 | 14.9 | 14.7 | 14.6 |
| C30 | Cold | LBGstat | S0 | S3 | G150 | T-5.40H | GM+25 | G135 | G180 |
| 12.2 | 12.4 | 12.6 | 12.8 | 12.8 | 13 | 13 | 13.1 | 13.2 | 13.2 |