| Start Page |
|
 |
| Start Page |
|
|
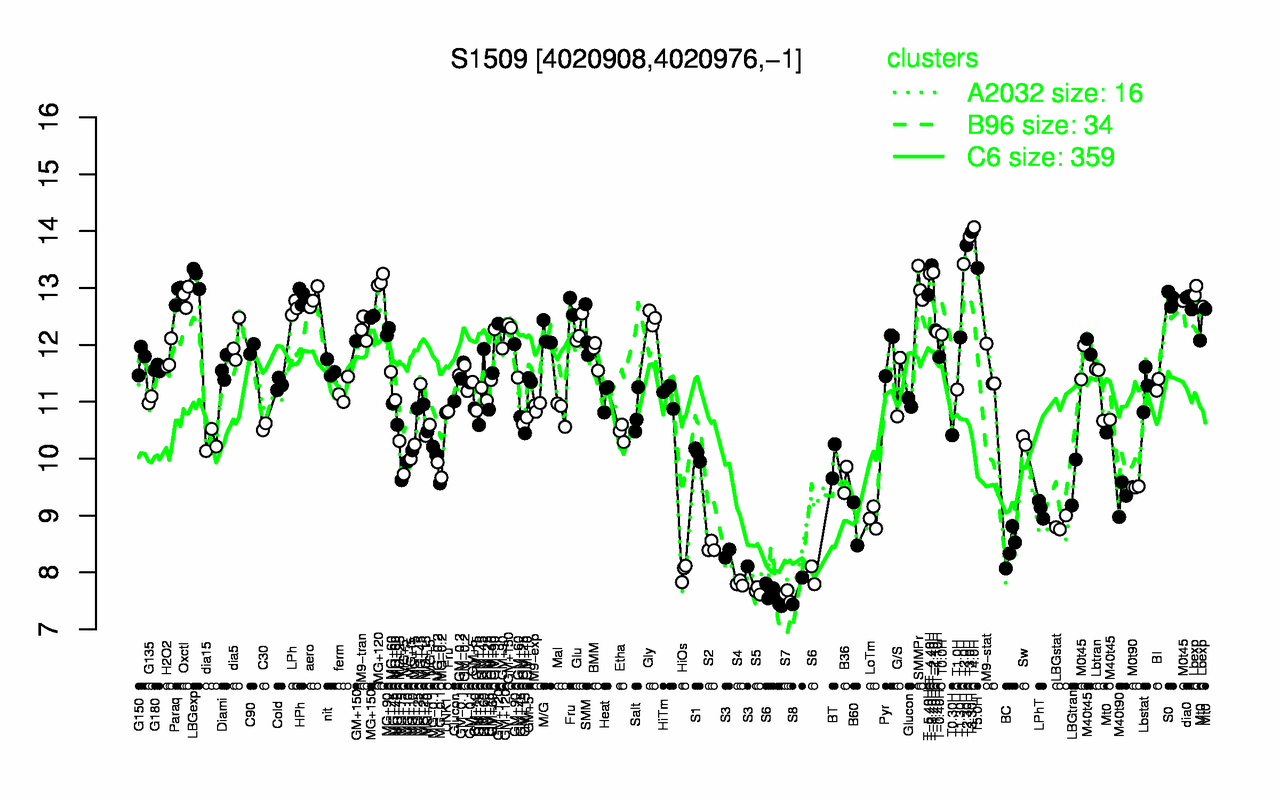
| T4.0H | T3.30H | T3.0H | T2.30H | T2.0H | T-3.40H | T5.0H | T-2.40H | T-4.40H | LBGexp |
| 14.1 | 14 | 13.9 | 13.8 | 13.4 | 13.4 | 13.4 | 13.3 | 13.3 | 13.2 |
| S7 | S8 | S5 | S6 | S4 | HiOs | S3 | BC | S2 | LBGstat |
| 7.6 | 7.67 | 7.68 | 7.68 | 7.81 | 8.01 | 8.26 | 8.44 | 8.45 | 8.85 |