| Start Page |
|
 |
| Start Page |
|
|
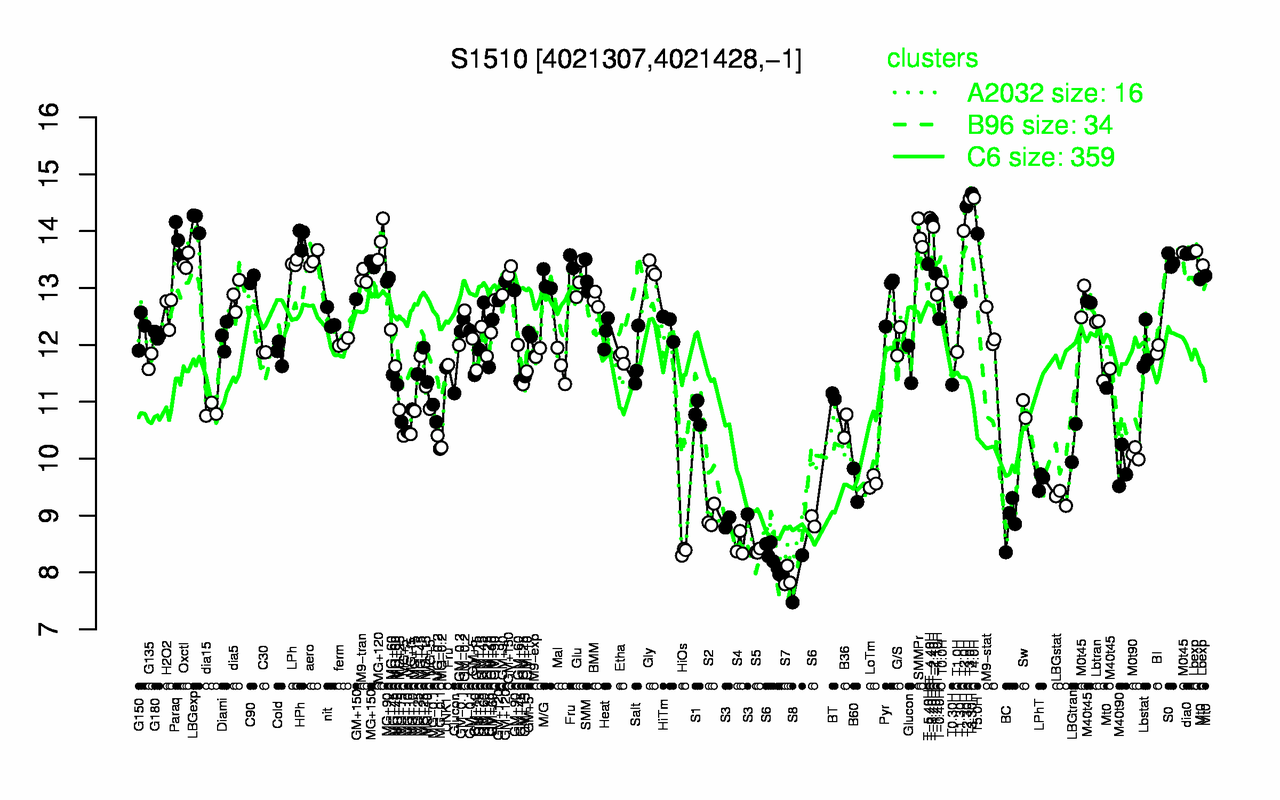
| T3.30H | T4.0H | T3.0H | T2.30H | T-4.40H | T-3.40H | LBGexp | T-2.40H | T2.0H | T5.0H |
| 14.7 | 14.6 | 14.6 | 14.4 | 14.2 | 14.2 | 14.2 | 14.1 | 14 | 14 |
| S8 | S7 | S6 | HiOs | S5 | S4 | BC | S3 | S2 | LBGstat |
| 7.89 | 7.91 | 8.37 | 8.37 | 8.37 | 8.48 | 8.89 | 8.93 | 8.97 | 9.31 |