| Start Page |
|
 |
| Start Page |
|
|
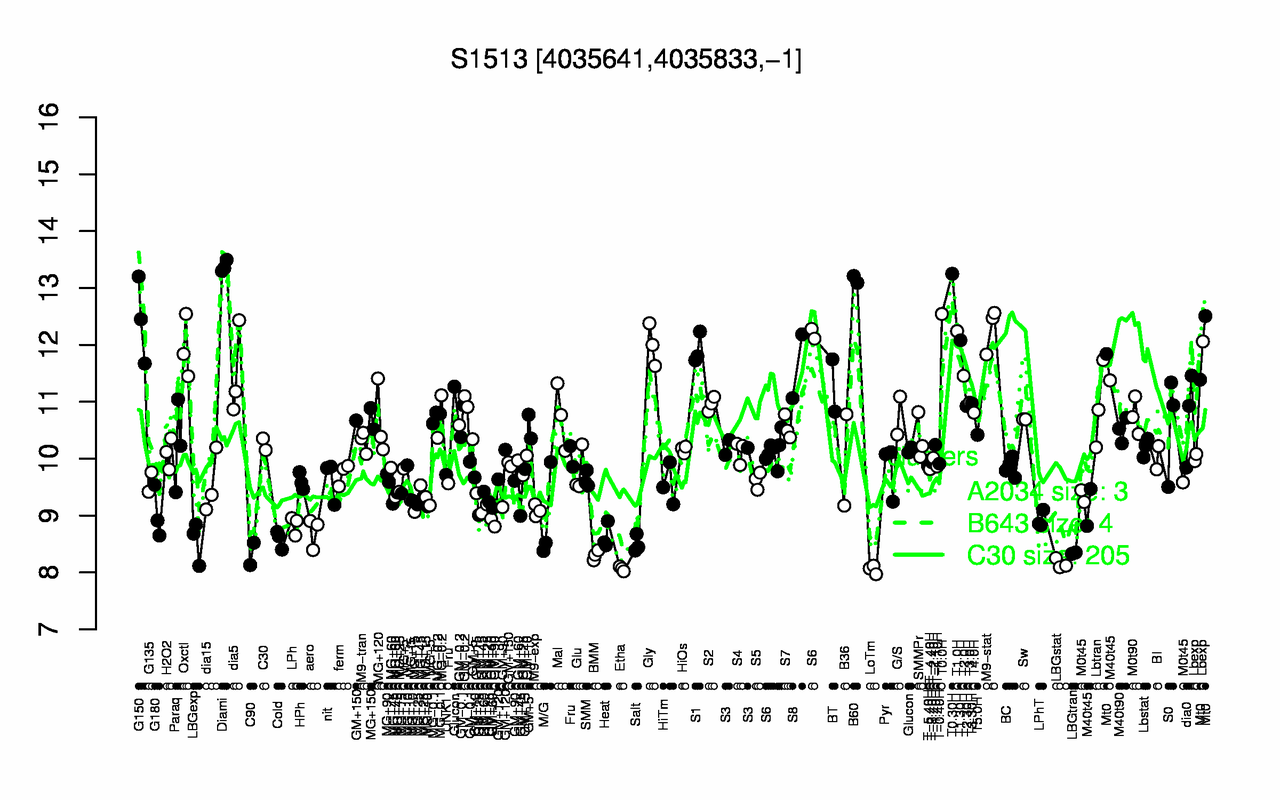
| Diami | T0.30H | B60 | T0.0H | G150 | M9-stat | T1.0H | T1.30H | Gly | Oxctl |
| 13.4 | 13.2 | 13.2 | 12.5 | 12.4 | 12.3 | 12.2 | 12.1 | 12 | 11.9 |
| LoTm | Etha | LBGstat | BMM | C90 | LBGtran | Salt | LBGexp | Cold | Heat |
| 8.05 | 8.06 | 8.16 | 8.3 | 8.33 | 8.34 | 8.5 | 8.55 | 8.58 | 8.64 |