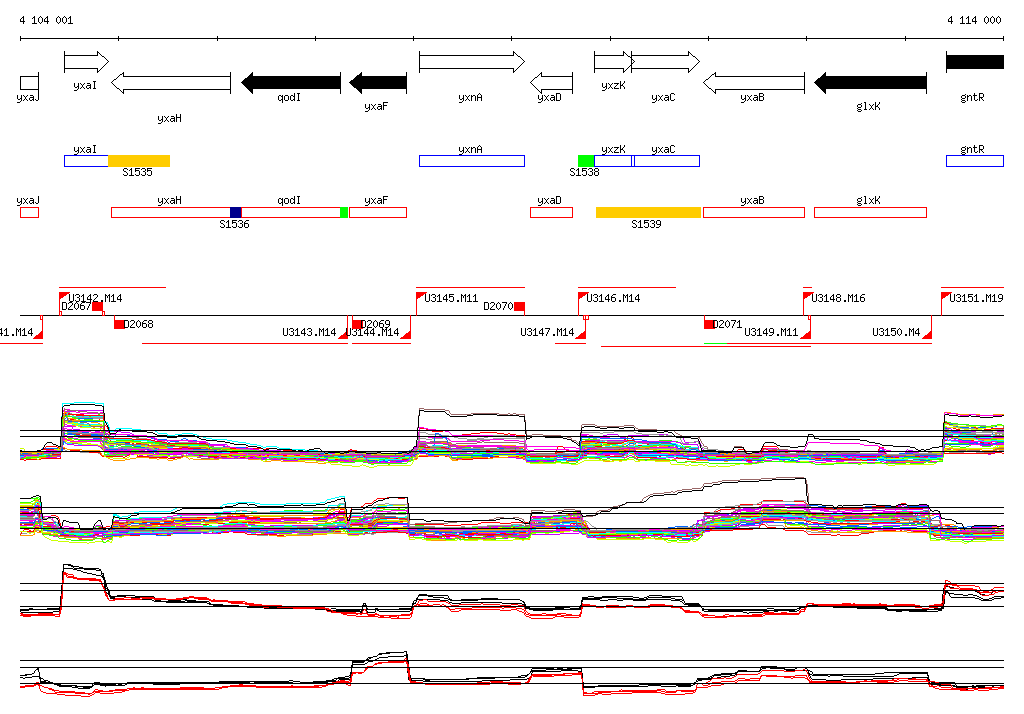
| Start Page |
|
 |
| Start Page |
|
|
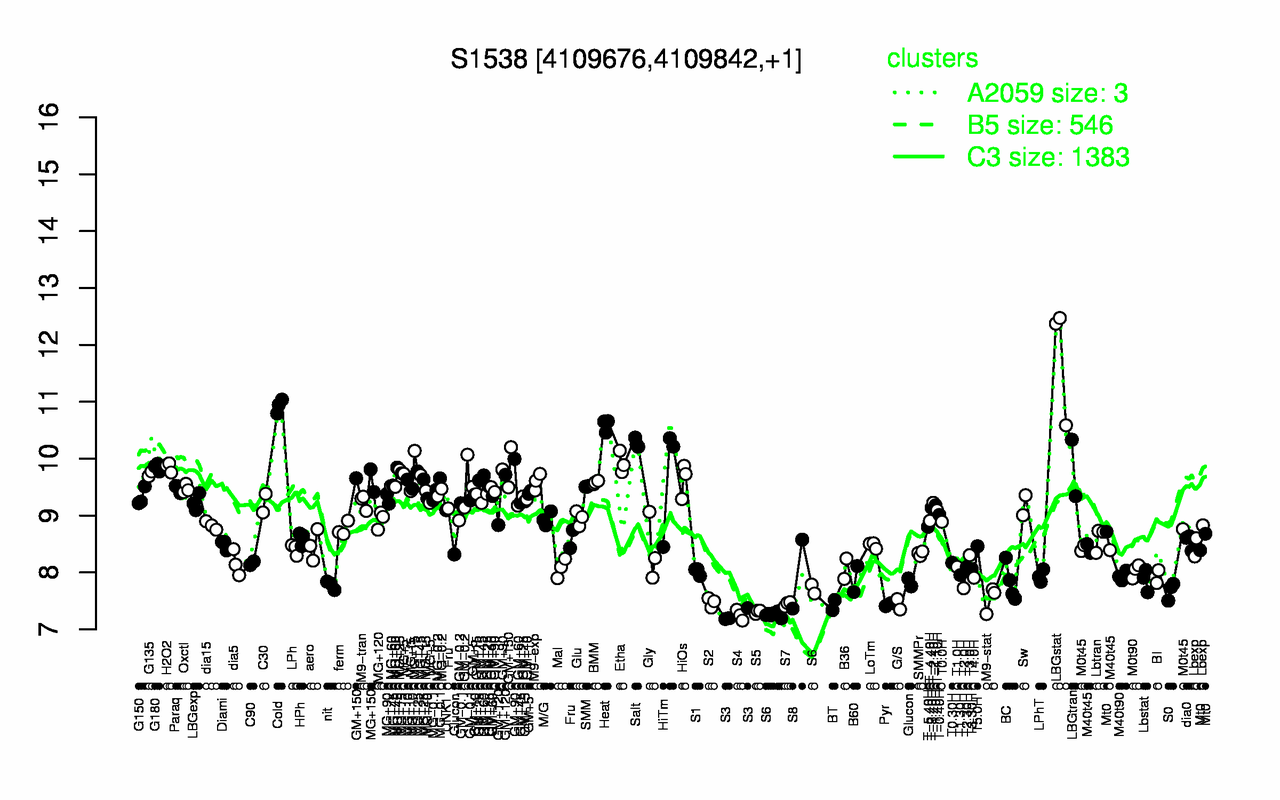
| LBGstat | Cold | Heat | Salt | Etha | H2O2 | G180 | LBGtran | GM+150 | MG+15 |
| 11.8 | 10.9 | 10.6 | 10.3 | 9.93 | 9.85 | 9.85 | 9.84 | 9.78 | 9.77 |
| S4 | S3 | S5 | S6 | BT | G/S | Pyr | S7 | S2 | M9-stat |
| 7.25 | 7.25 | 7.31 | 7.36 | 7.43 | 7.44 | 7.44 | 7.45 | 7.47 | 7.54 |