| Start Page |
|
 |
| Start Page |
|
|
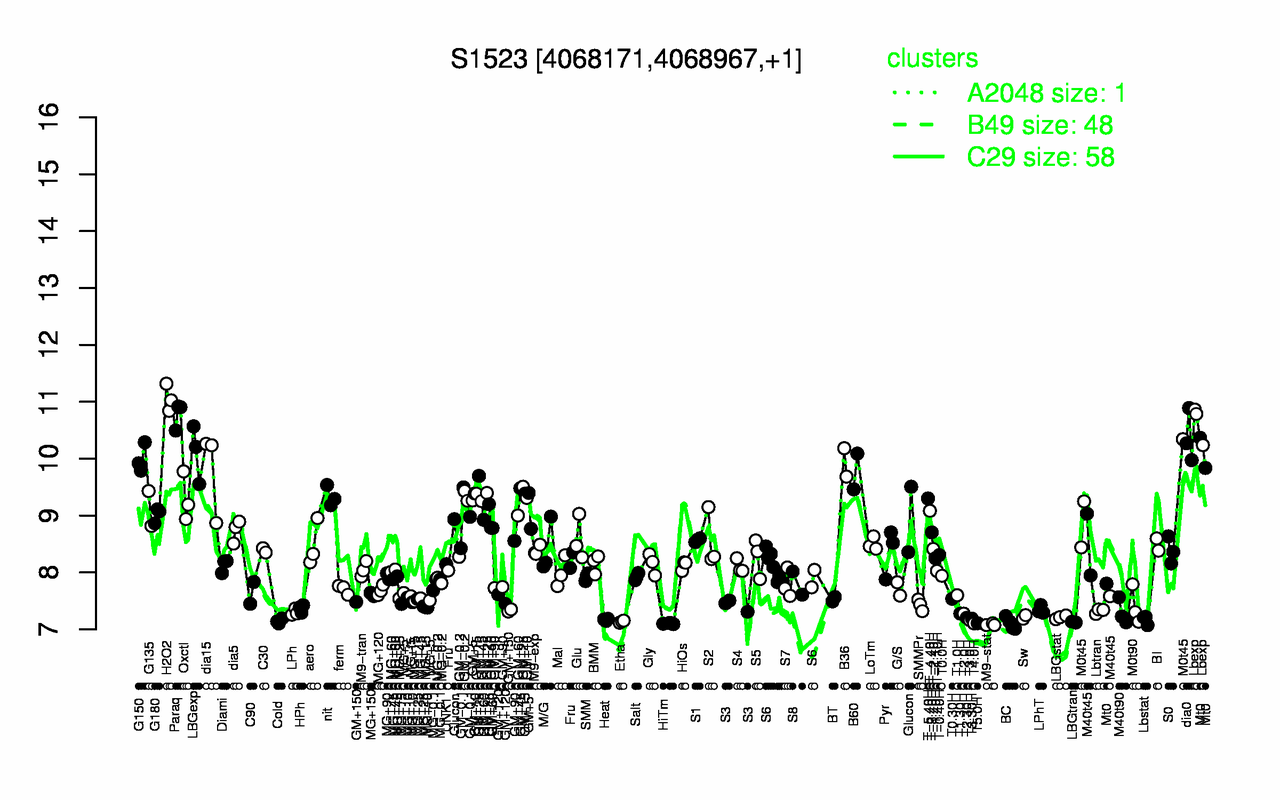
| H2O2 | Paraq | Lbexp | dia0 | LBGexp | G150 | B36 | dia15 | B60 | GM+25 |
| 11.1 | 10.8 | 10.6 | 10.4 | 10.1 | 10 | 9.93 | 9.79 | 9.77 | 9.53 |
| M9-stat | HiTm | BC | T4.0H | T5.0H | LBGtran | Etha | Cold | T3.0H | Lbstat |
| 7.09 | 7.1 | 7.1 | 7.11 | 7.11 | 7.13 | 7.14 | 7.15 | 7.16 | 7.17 |