| Start Page |
|
 |
| Start Page |
|
|
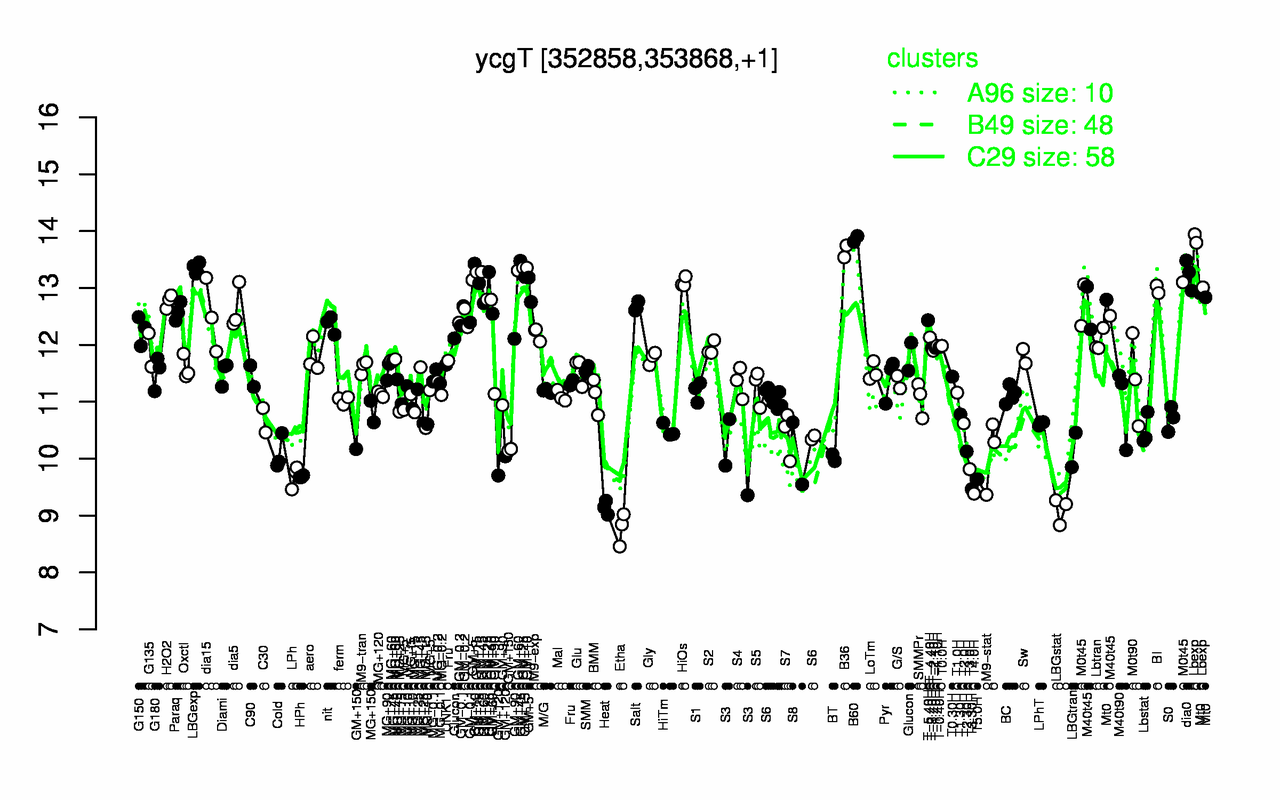
| B60 | B36 | Lbexp | GM+10 | LBGexp | GM+15 | dia0 | GM+45 | HiOs | GM+25 |
| 13.9 | 13.6 | 13.6 | 13.4 | 13.4 | 13.3 | 13.2 | 13.2 | 13.1 | 13.1 |
| Etha | LBGstat | Heat | T4.0H | T3.30H | T5.0H | HPh | LPh | T3.0H | GM+120 |
| 8.77 | 9.1 | 9.14 | 9.39 | 9.46 | 9.64 | 9.69 | 9.69 | 9.82 | 9.87 |