| Start Page |
|
 |
| Start Page |
|
|
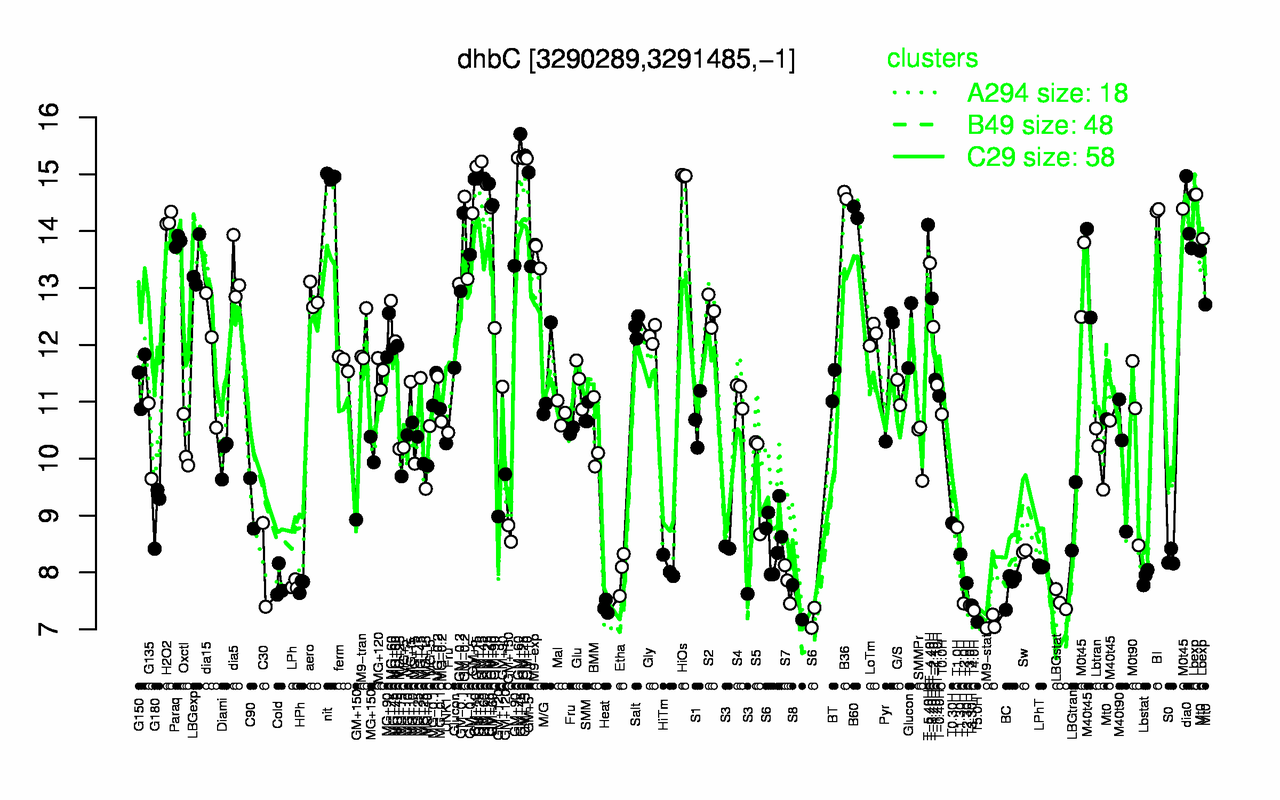
| GM+45 | GM+15 | GM+10 | GM+25 | HiOs | nit | GM+60 | B36 | Lbexp | BI |
| 15.1 | 15.1 | 15.1 | 15 | 15 | 15 | 14.9 | 14.6 | 14.4 | 14.4 |
| M9-stat | T5.0H | T4.0H | Heat | T3.30H | T3.0H | T2.0H | S8 | LBGstat | BC |
| 7.11 | 7.13 | 7.33 | 7.39 | 7.42 | 7.42 | 7.45 | 7.48 | 7.51 | 7.76 |