| Start Page |
|
 |
| Start Page |
|
|
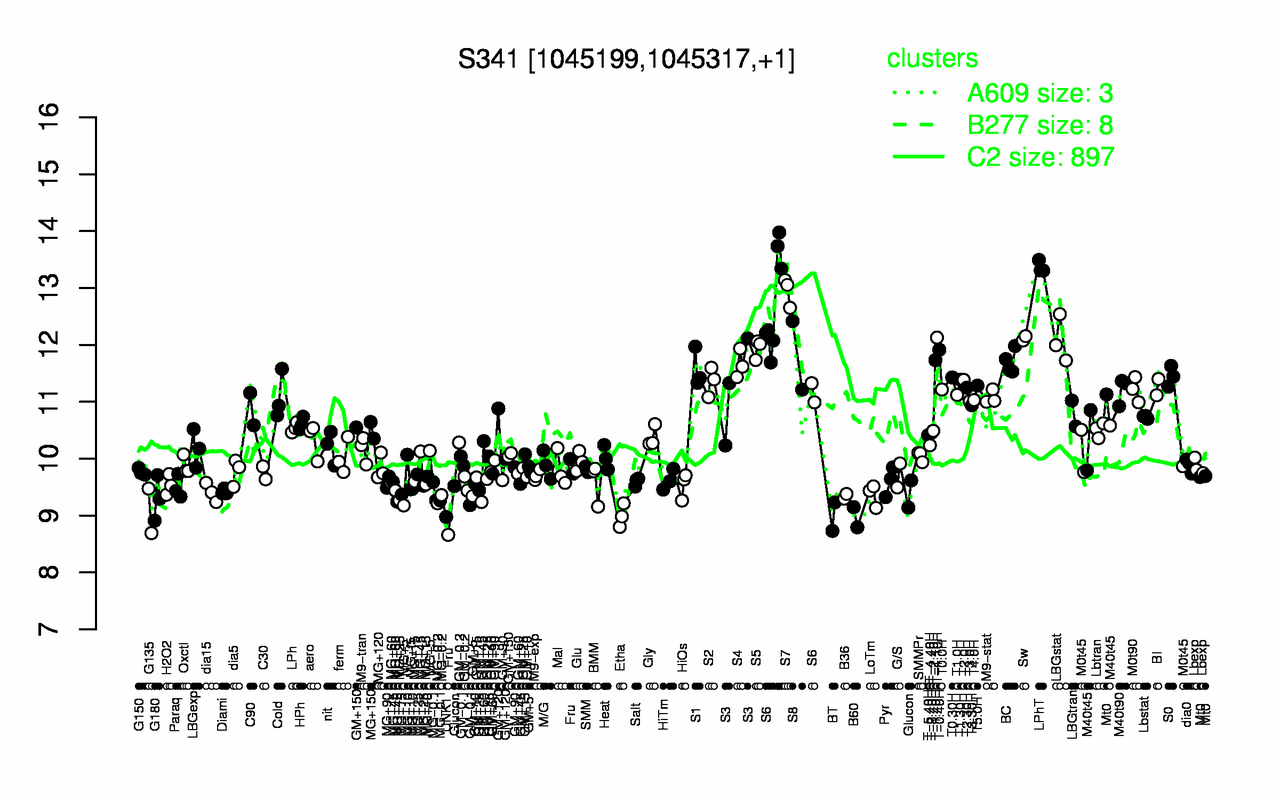
| LPhT | S7 | S6 | T-1.10H | Sw | LBGstat | S5 | T-0.40H | S8 | T-1.40H |
| 13.4 | 12.9 | 12.4 | 12.1 | 12.1 | 12.1 | 11.9 | 11.9 | 11.8 | 11.7 |
| B60 | UNK1 | BT | Etha | G135 | MG-0.2 | G180 | B36 | LoTm | MG-0.1 |
| 8.97 | 8.97 | 8.98 | 9 | 9.08 | 9.29 | 9.3 | 9.34 | 9.36 | 9.37 |