| Start Page |
|
 |
| Start Page |
|
|
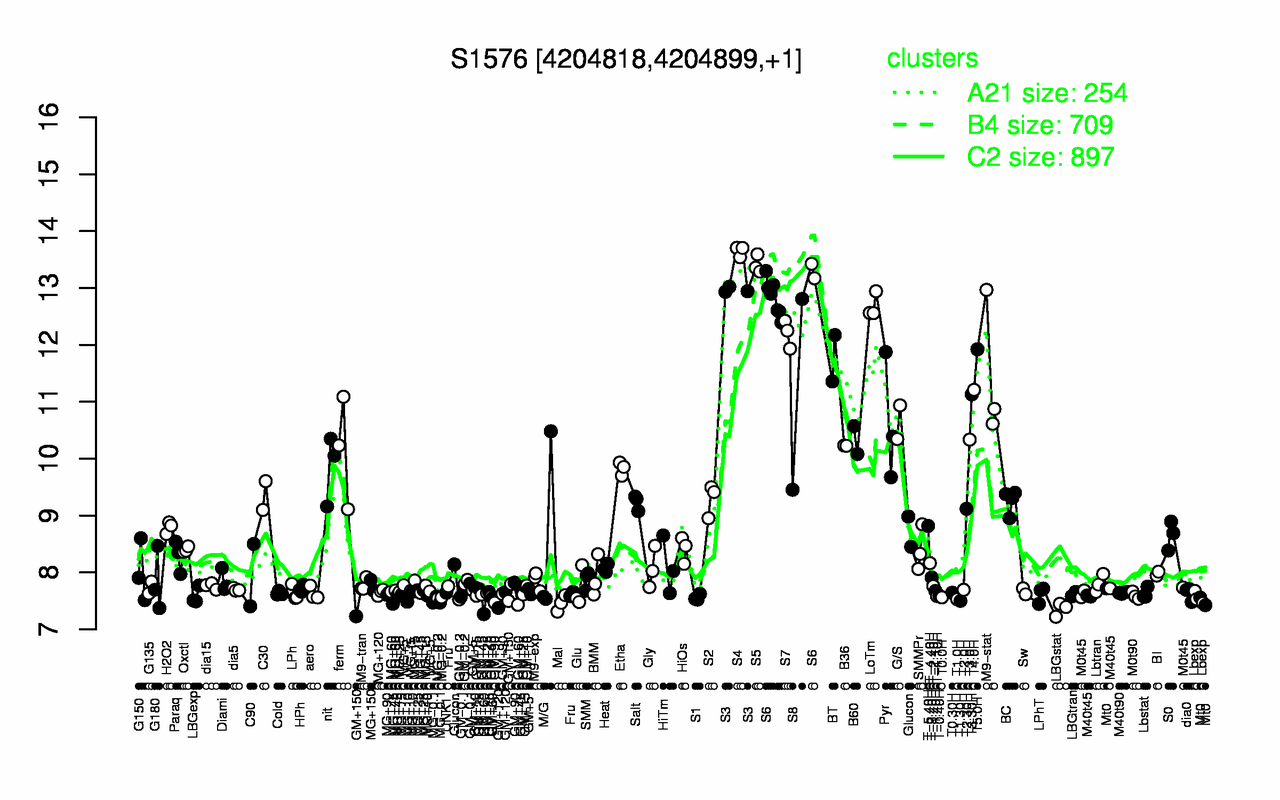
| S4 | S5 | S3 | S6 | LoTm | S7 | T5.0H | BT | M9-stat | T4.0H |
| 13.7 | 13.4 | 13 | 12.9 | 12.7 | 12.2 | 11.9 | 11.8 | 11.5 | 11.2 |
| LBGstat | GM+60 | Mal | T1.30H | MG-0.1 | GM+150 | GM+120 | T1.0H | MG-0.2 | Lbexp |
| 7.35 | 7.42 | 7.46 | 7.5 | 7.51 | 7.51 | 7.52 | 7.53 | 7.55 | 7.56 |