| Start Page |
|
 |
| Start Page |
|
|
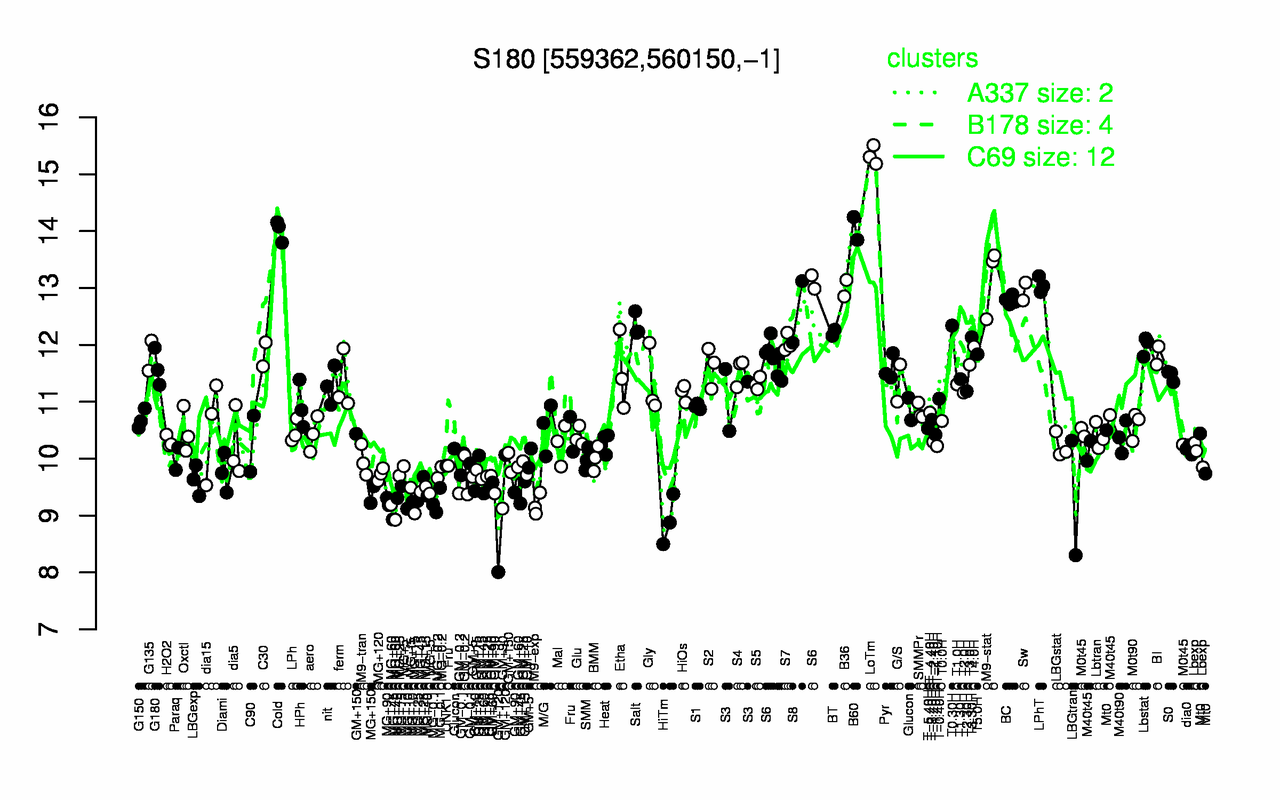
| LoTm | B60 | Cold | M9-stat | LPhT | B36 | Sw | BC | S8 | Salt |
| 15.3 | 14 | 14 | 13.2 | 13.1 | 13 | 12.9 | 12.8 | 12.6 | 12.3 |
| HiTm | GM+120 | MG+60 | M9-exp | MG+45 | MG+10 | MG+90 | MG-0.1 | GM+90 | LBGtran |
| 8.92 | 9.04 | 9.06 | 9.19 | 9.22 | 9.24 | 9.25 | 9.25 | 9.31 | 9.31 |