| Start Page |
|
 |
| Start Page |
|
|
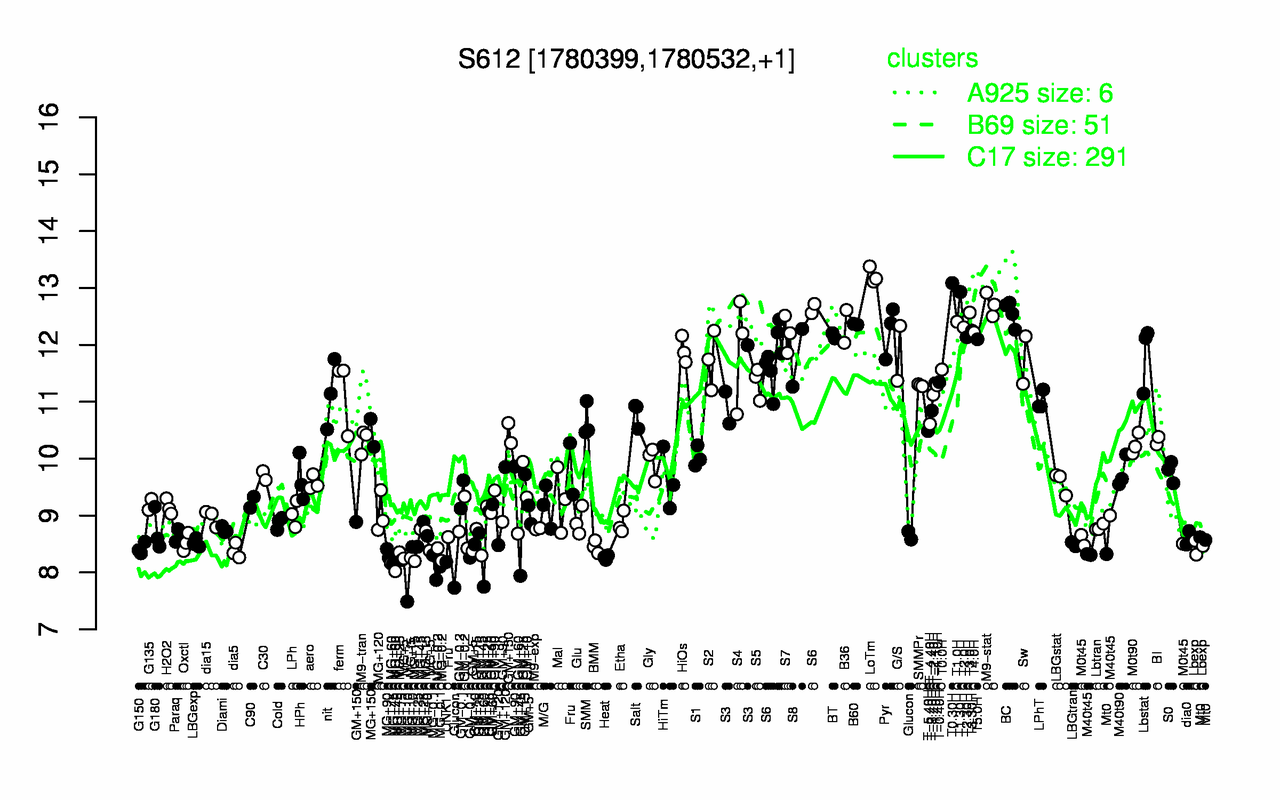
| LoTm | T0.30H | T1.30H | M9-stat | T3.0H | BC | T1.0H | B60 | B36 | T2.0H |
| 13.2 | 13.1 | 12.9 | 12.7 | 12.6 | 12.6 | 12.4 | 12.4 | 12.3 | 12.3 |
| MG-0.1 | MG+60 | UNK1 | MG+10 | MG+t5 | Heat | MG+5 | MG-0.2 | MG+90 | Glucon |
| 8.09 | 8.09 | 8.18 | 8.19 | 8.26 | 8.26 | 8.31 | 8.31 | 8.34 | 8.34 |