| Start Page |
|
 |
| Start Page |
|
|
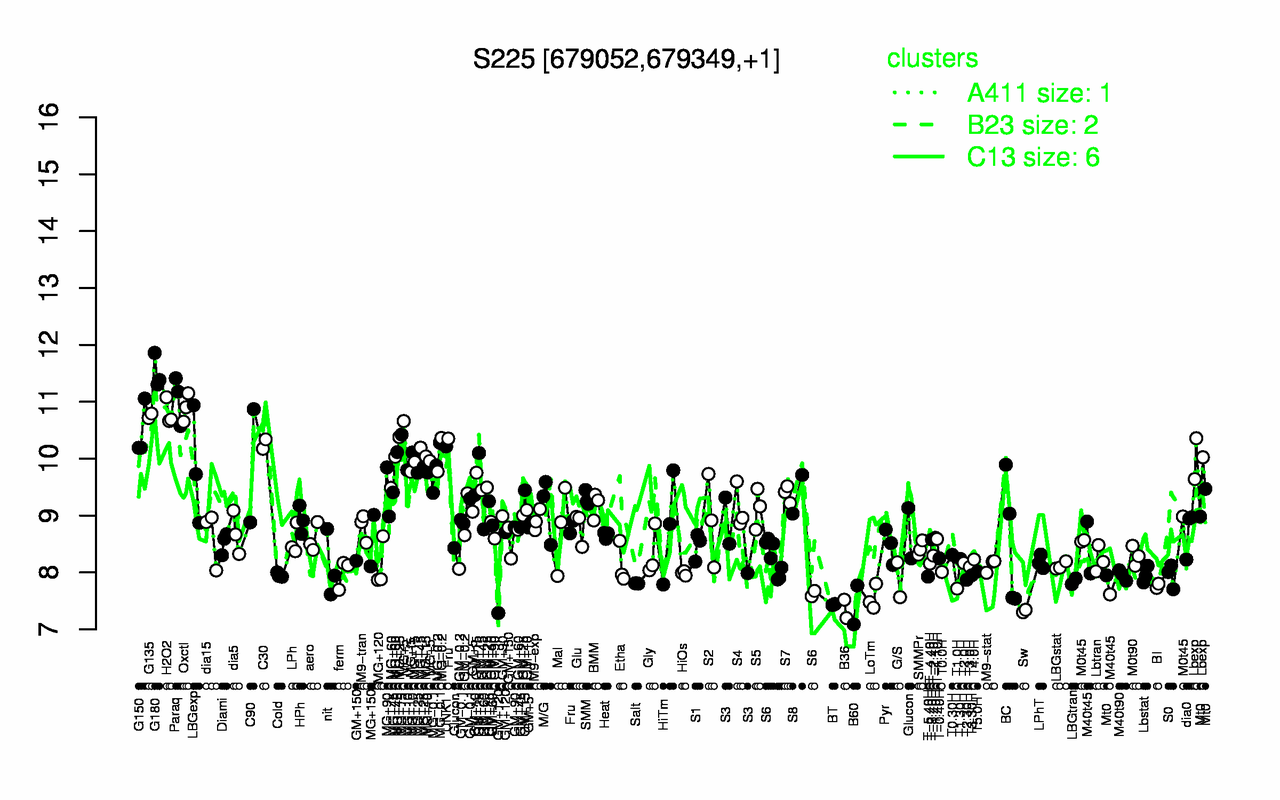
| G180 | Paraq | Oxctl | H2O2 | G135 | G150 | MG+5 | C30 | UNK1 | MG+15 |
| 11.5 | 11.1 | 10.9 | 10.8 | 10.8 | 10.5 | 10.3 | 10.3 | 10.2 | 10.1 |
| Sw | B36 | B60 | BT | LoTm | T1.0H | BI | Salt | LBGtran | T2.30H |
| 7.32 | 7.36 | 7.43 | 7.44 | 7.55 | 7.72 | 7.76 | 7.81 | 7.84 | 7.87 |