| Start Page |
|
 |
| Start Page |
|
|
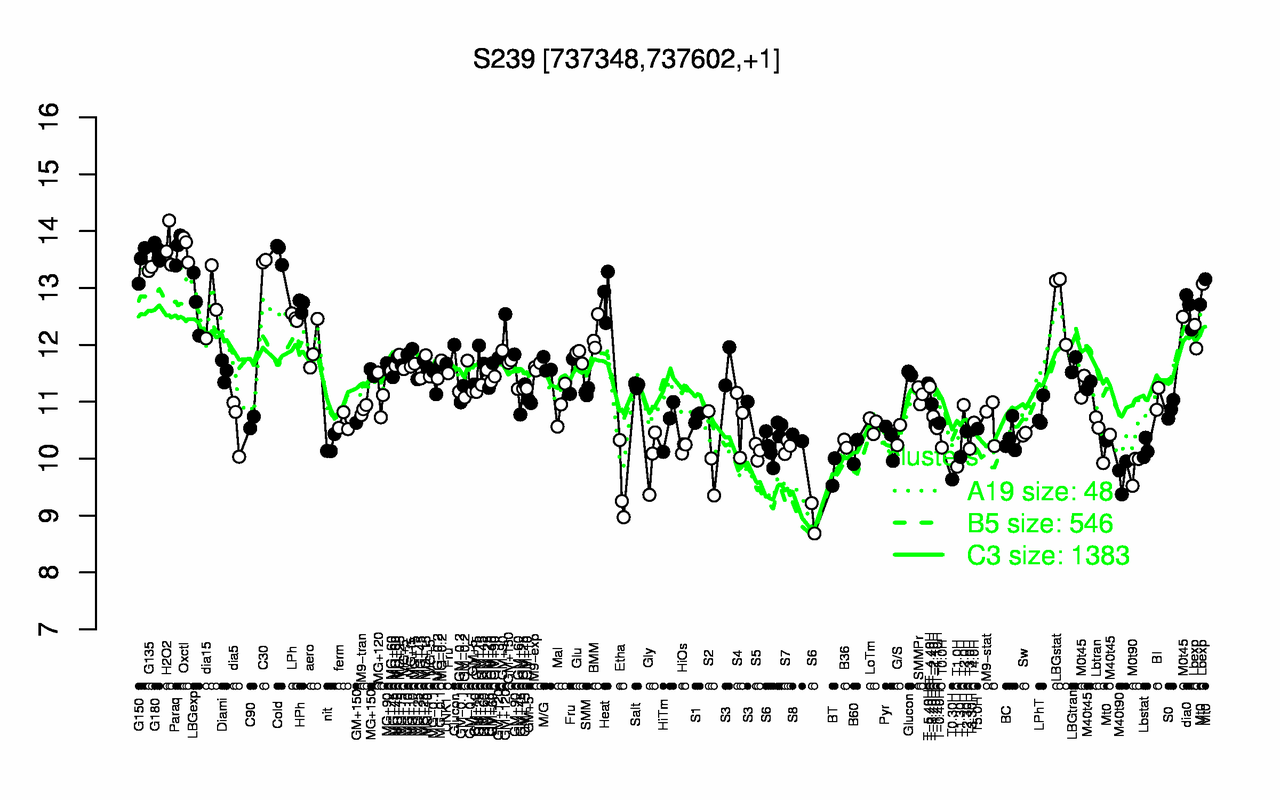
| H2O2 | Oxctl | Paraq | G180 | Cold | C30 | G150 | G135 | Heat | LBGstat |
| 13.7 | 13.7 | 13.7 | 13.7 | 13.6 | 13.5 | 13.4 | 13.3 | 12.9 | 12.8 |
| Etha | T0.30H | M40t90 | BT | M0t90 | T1.0H | Gly | S6 | T1.30H | S2 |
| 9.52 | 9.63 | 9.71 | 9.77 | 9.84 | 9.86 | 9.97 | 10 | 10 | 10.1 |