| Start Page |
|
 |
| Start Page |
|
|
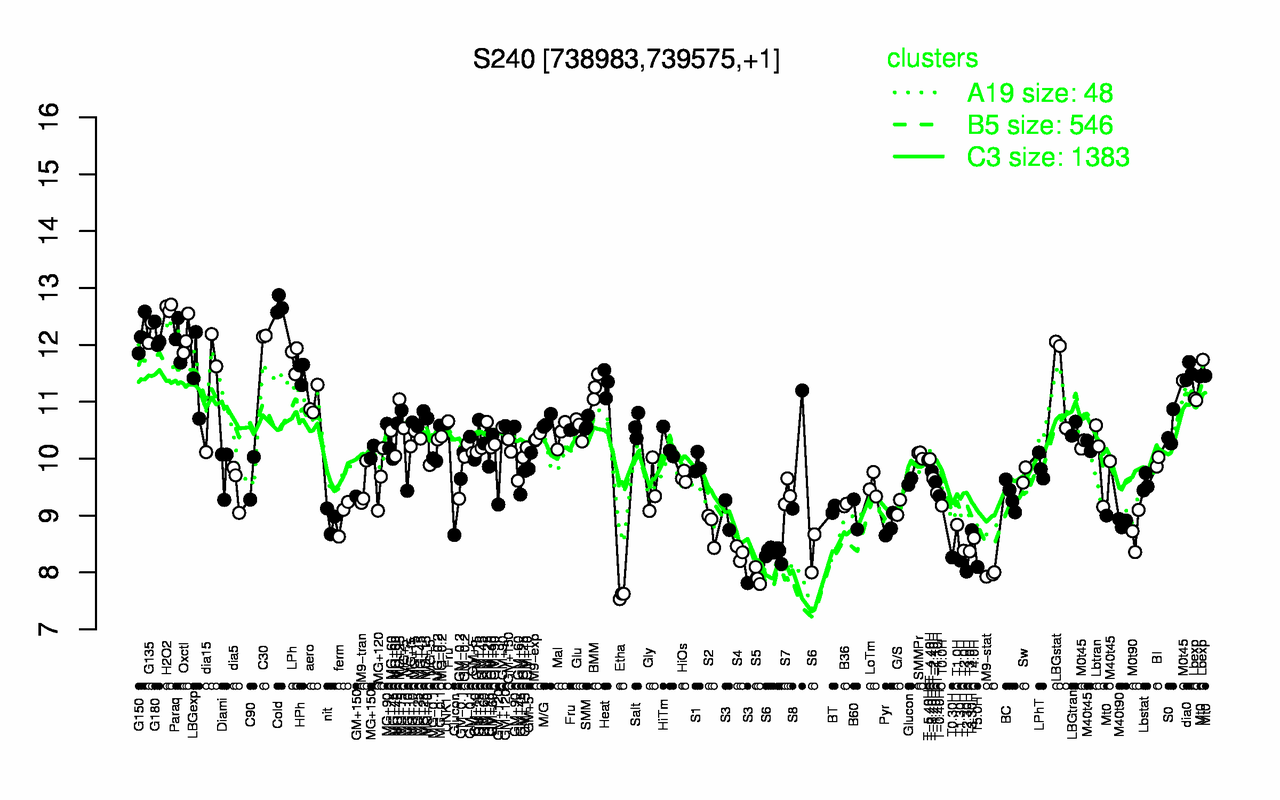
| Cold | H2O2 | G135 | G150 | Oxctl | G180 | C30 | Paraq | LPh | HPh |
| 12.7 | 12.7 | 12.2 | 12.2 | 12.2 | 12.2 | 12.2 | 12.1 | 11.8 | 11.5 |
| Etha | S5 | M9-stat | T2.30H | T5.0H | T1.30H | T0.30H | S4 | S6 | T3.0H |
| 7.59 | 7.93 | 7.96 | 8.02 | 8.1 | 8.21 | 8.26 | 8.34 | 8.34 | 8.37 |