| Start Page |
|
 |
| Start Page |
|
|
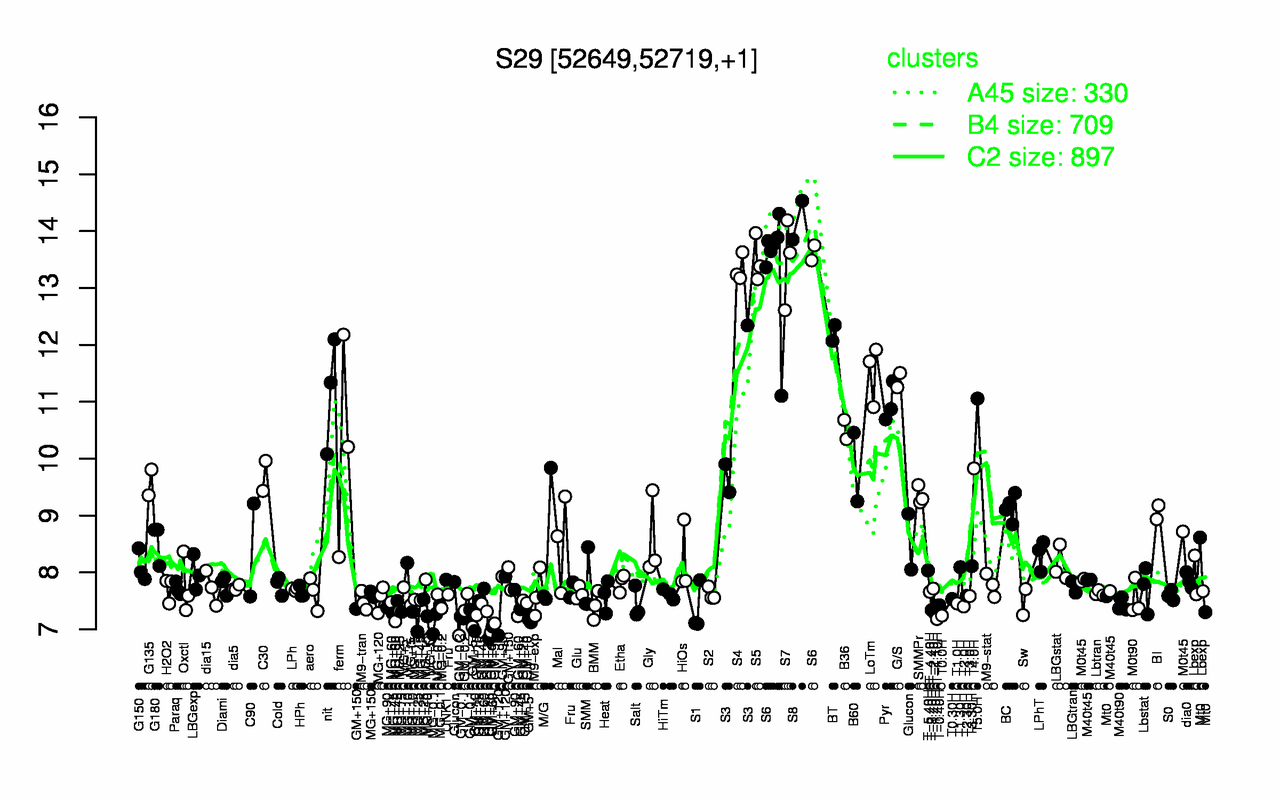
| S8 | S5 | S7 | S6 | S4 | BT | LoTm | G/S | nit | T5.0H |
| 14.2 | 13.5 | 13.5 | 13.5 | 13.3 | 12.2 | 11.5 | 11.4 | 11.2 | 11.1 |
| GM+5 | GM+15 | T-1.10H | MG-0.1 | GM+10 | T0.0H | GM+45 | GM-0.1 | MG+25 | T-1.40H |
| 7.12 | 7.15 | 7.18 | 7.2 | 7.22 | 7.24 | 7.25 | 7.25 | 7.27 | 7.28 |