| Start Page |
|
 |
| Start Page |
|
|
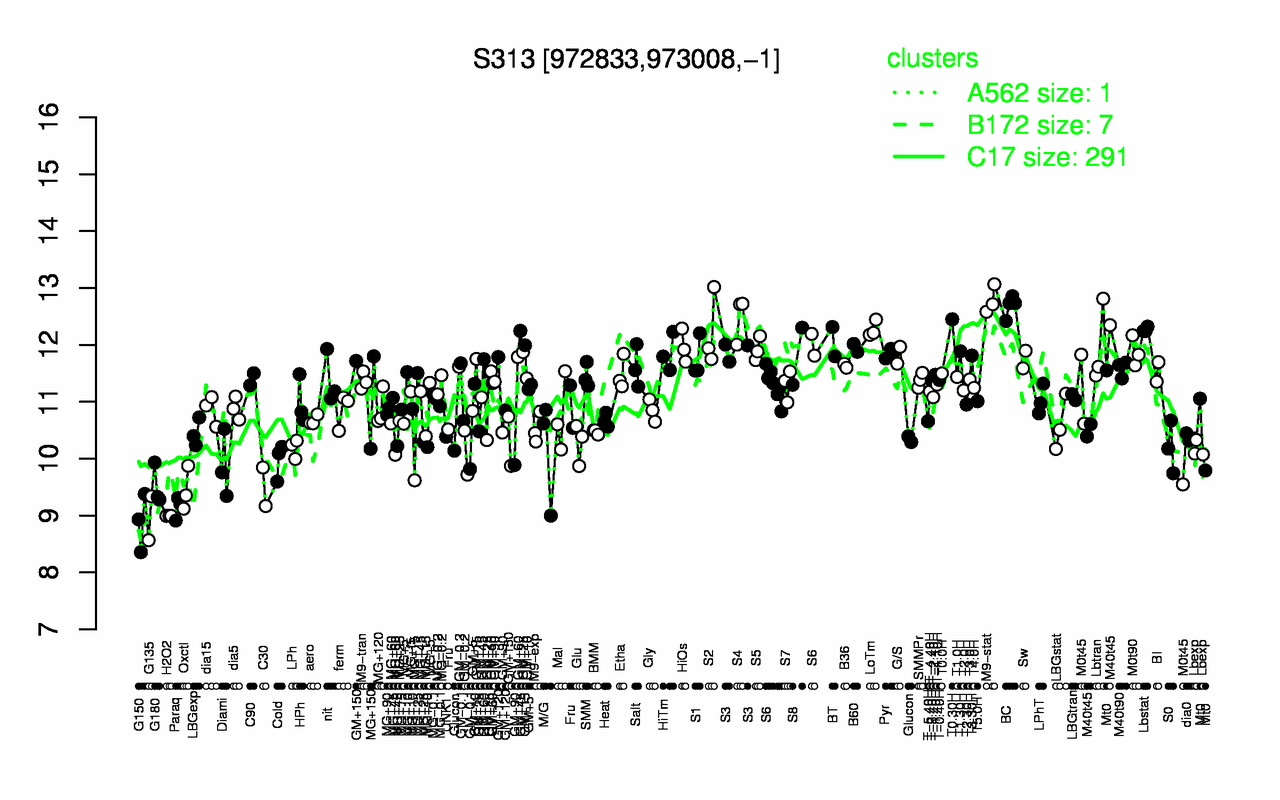
| M9-stat | BC | S4 | T0.30H | LoTm | Lbstat | S2 | BT | HiOs | Lbtran |
| 12.8 | 12.7 | 12.5 | 12.4 | 12.3 | 12.3 | 12.2 | 12.1 | 12 | 12 |
| G150 | G135 | H2O2 | Paraq | Oxctl | C30 | G180 | Diami | Cold | M/G |
| 8.89 | 8.95 | 9 | 9.14 | 9.45 | 9.51 | 9.51 | 9.88 | 9.97 | 10.2 |