| Start Page |
|
 |
| Start Page |
|
|
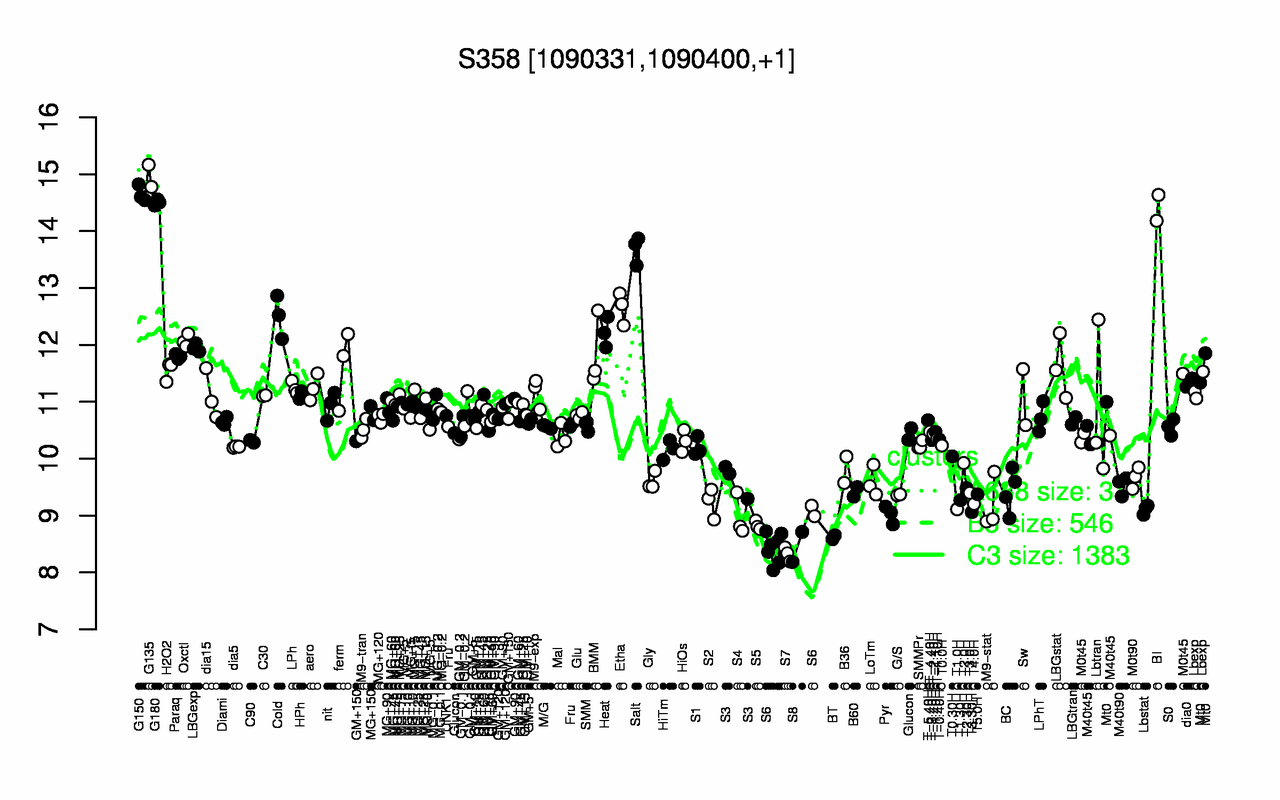
| G135 | G150 | G180 | BI | Salt | Etha | Cold | Heat | Oxctl | LBGexp |
| 15 | 14.7 | 14.5 | 14.4 | 13.7 | 12.7 | 12.5 | 12.2 | 12.1 | 11.9 |
| S7 | S8 | S6 | BT | S5 | S4 | Pyr | T3.30H | Lbstat | T1.0H |
| 8.32 | 8.45 | 8.57 | 8.62 | 8.83 | 8.98 | 9.02 | 9.06 | 9.11 | 9.11 |