| Start Page |
|
 |
| Start Page |
|
|
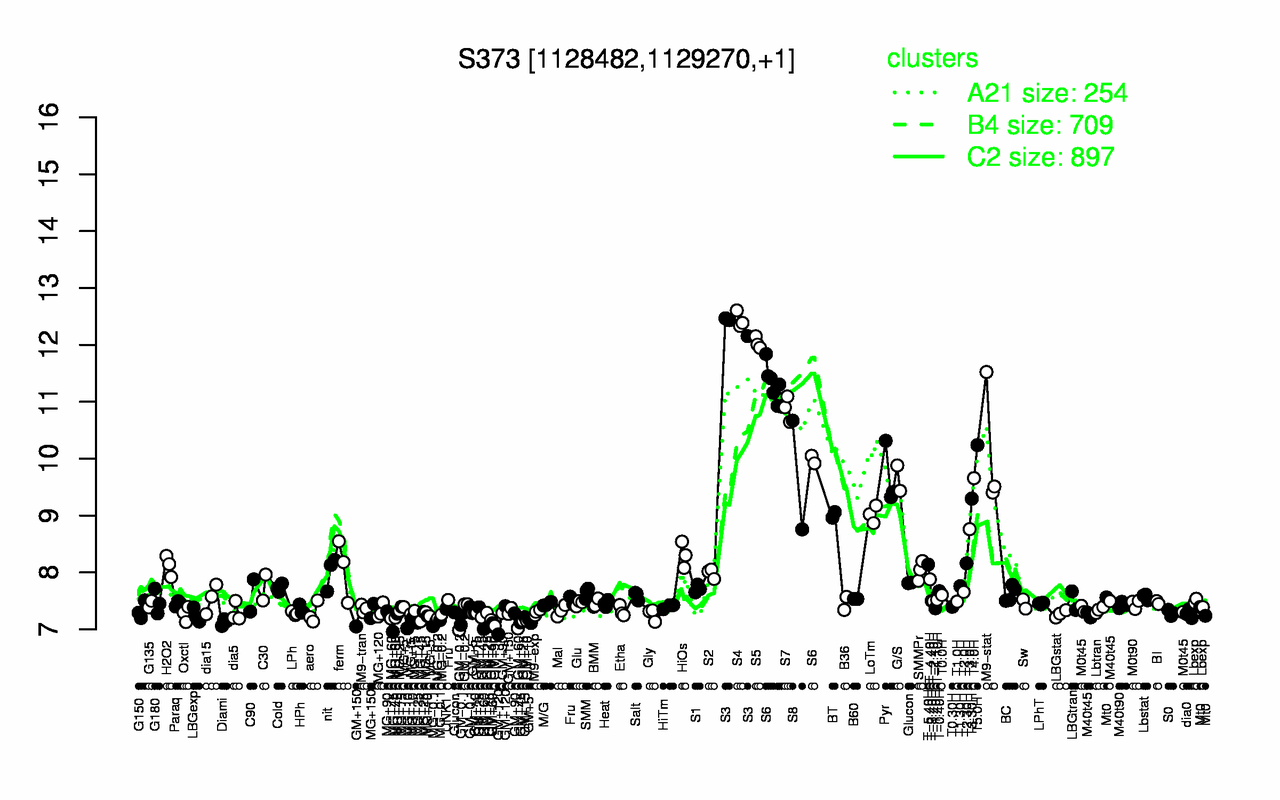
| S4 | S3 | S5 | S6 | S7 | T5.0H | M9-stat | S8 | Pyr | G/S |
| 12.4 | 12.4 | 12 | 11 | 10.9 | 10.2 | 10.1 | 9.71 | 9.68 | 9.66 |
| GM+60 | MG-0.1 | MG+45 | Diami | MG+10 | GM+120 | GM+45 | GM+15 | GM+5 | MG+60 |
| 7.04 | 7.12 | 7.12 | 7.13 | 7.15 | 7.16 | 7.16 | 7.19 | 7.19 | 7.2 |