B. subtilis Expression Data Browser
Start Page
B. subtilis Expression Data Browser
Gene/Segment:
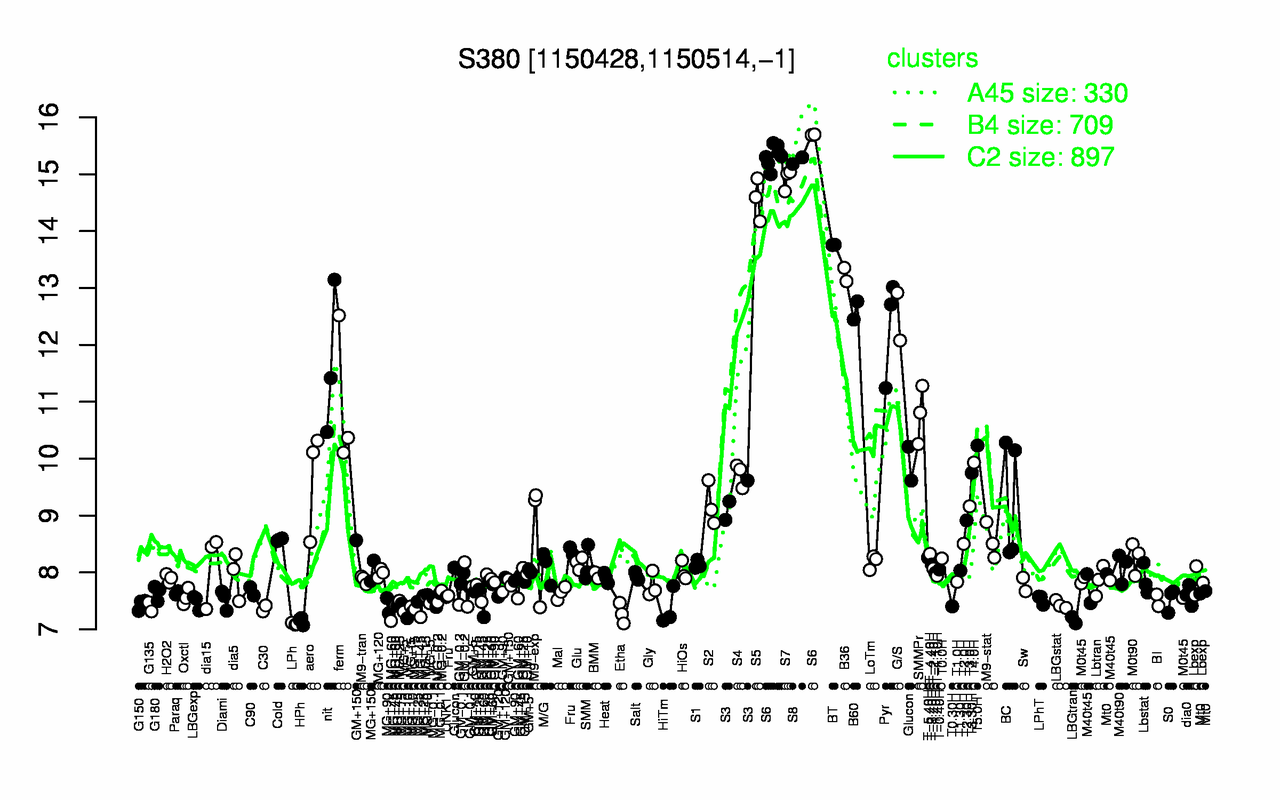
S380
Locus Tag:
new_1150428_1150514_c
Details about S380
Show/Hide
Highest Expression Conditions
S6
S8
S7
S5
BT
B36
B60
G/S
Pyr
nit
15.4
15.2
14.9
14.6
13.8
13.2
12.6
12.5
12.3
11.7
Lowest Expression Conditions
LPh
HPh
LBGtran
Etha
MG+60
MG+45
MG+10
C30
HiTm
MG+5
7.1
7.15
7.16
7.28
7.28
7.36
7.37
7.37
7.38
7.38
Most Positively Correlated Segments
gerPA
gerPB
gerPC
gerPD
gerPE
gerPF
ytlA
ytlD
ytlC
gerT
0.99
0.98
0.98
0.98
0.98
0.97
0.96
0.96
0.96
0.96
Most Negatively Correlated Segments
yeaC
yviA
sbcD
sfp
yvrG
S378
sbcC
asnS
addA
sfp
-0.85
-0.85
-0.83
-0.83
-0.83
-0.83
-0.83
-0.83
-0.83
-0.82
Expression Profile of Segment S380
Show/Hide
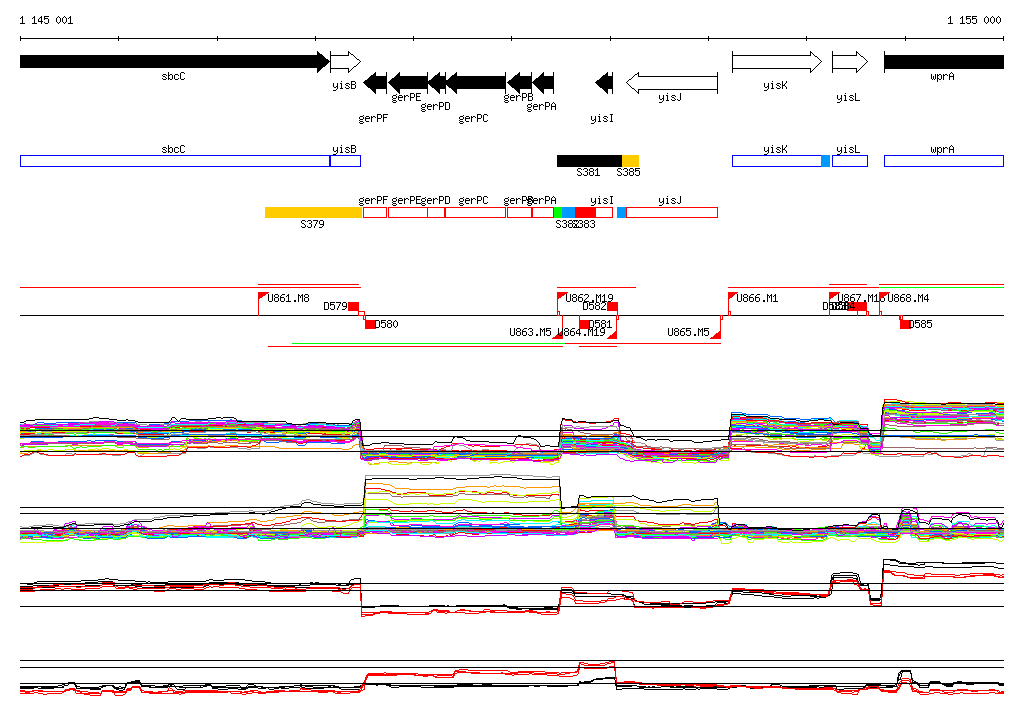
Genomic View of Gene/Segment S380
Show/Hide
(Legend)
Browse Genome Context