| Start Page |
|
 |
| Start Page |
|
|
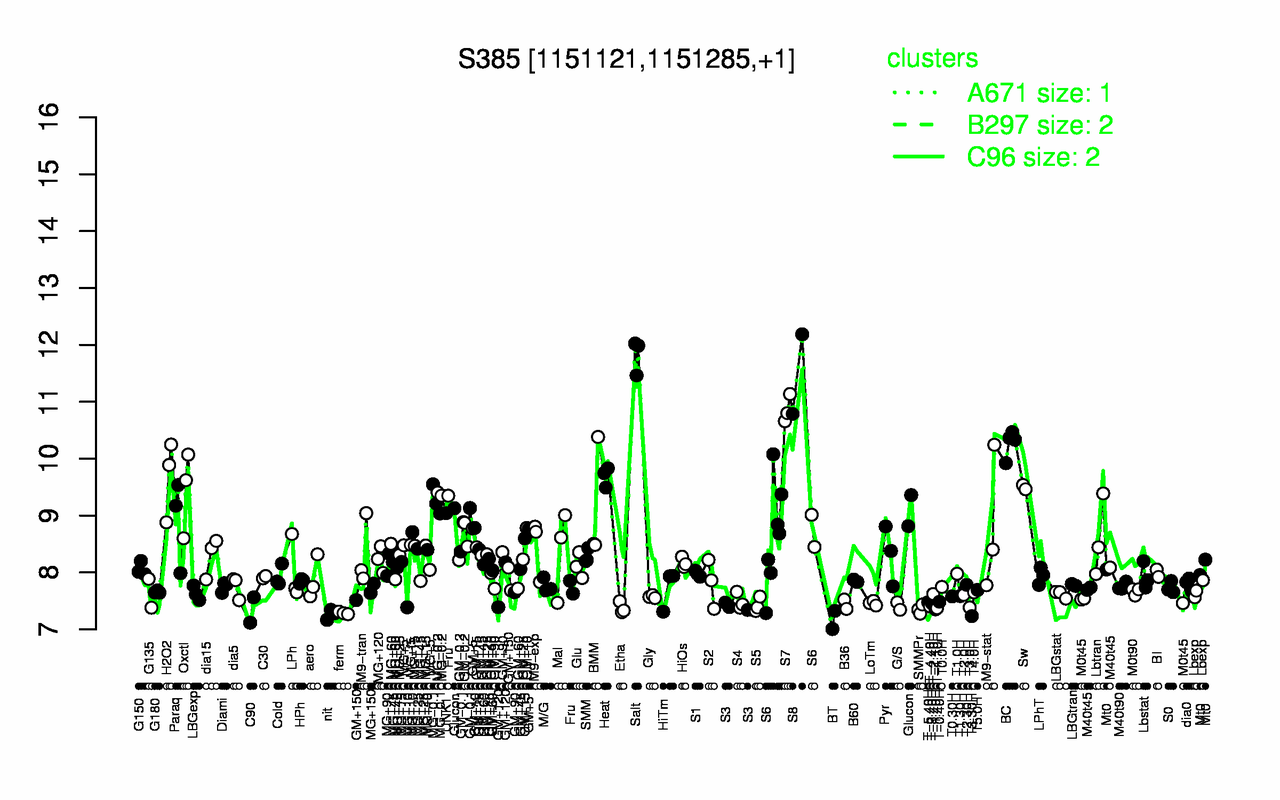
| Salt | S8 | S7 | BC | Heat | H2O2 | Sw | Oxctl | MG-0.2 | MG-0.1 |
| 11.8 | 11.5 | 10.9 | 10.3 | 9.69 | 9.67 | 9.5 | 9.43 | 9.38 | 9.26 |
| BT | T3.30H | nit | ferm | C90 | SMMPr | T-1.40H | T-1.10H | Etha | T3.0H |
| 7.17 | 7.23 | 7.26 | 7.29 | 7.34 | 7.35 | 7.35 | 7.37 | 7.38 | 7.38 |