| Start Page |
|
 |
| Start Page |
|
|
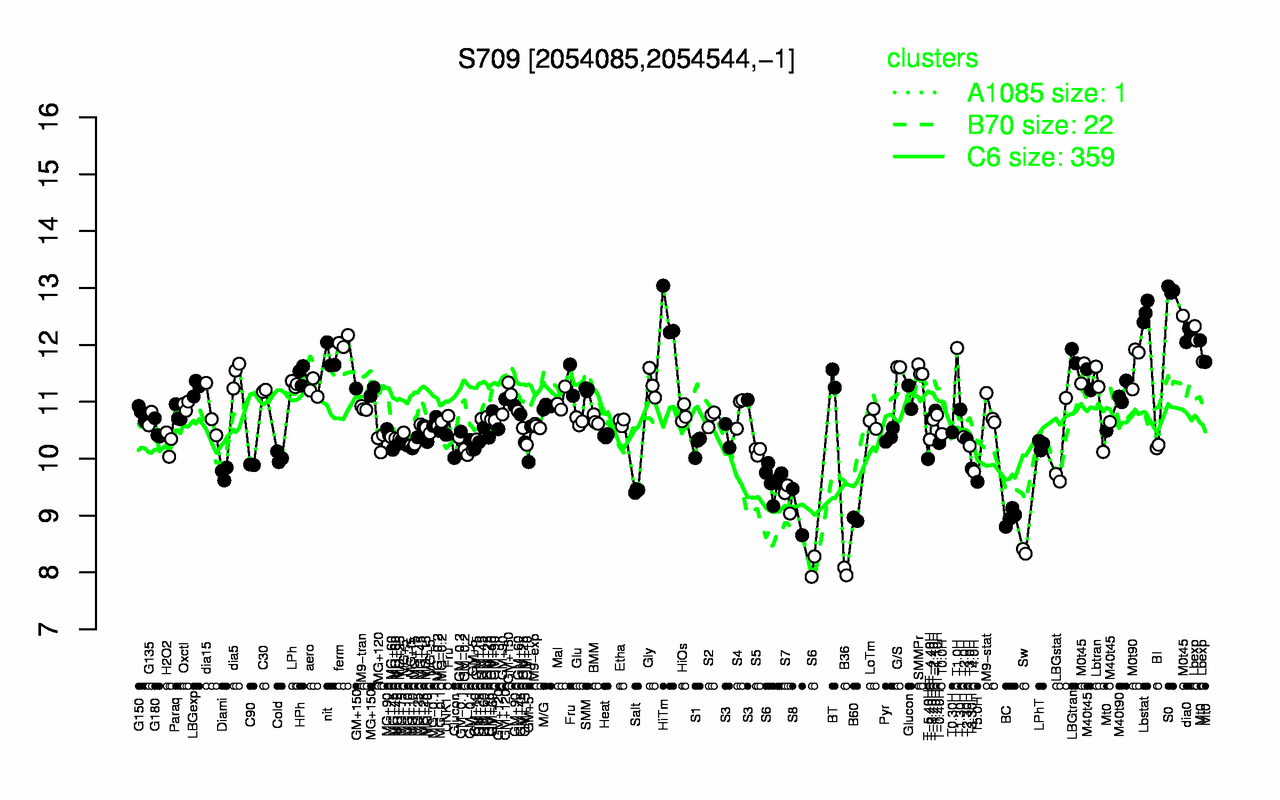
| S0 | Lbstat | HiTm | dia0 | ferm | Lbexp | T1.0H | M0t45 | LBGtran | nit |
| 13 | 12.6 | 12.5 | 12.2 | 12.1 | 12 | 11.9 | 11.8 | 11.8 | 11.8 |
| B36 | Sw | B60 | BC | S8 | S6 | S7 | Salt | T5.0H | Diami |
| 8.02 | 8.37 | 8.93 | 8.97 | 9.06 | 9.29 | 9.32 | 9.44 | 9.59 | 9.75 |