| Start Page |
|
 |
| Start Page |
|
|
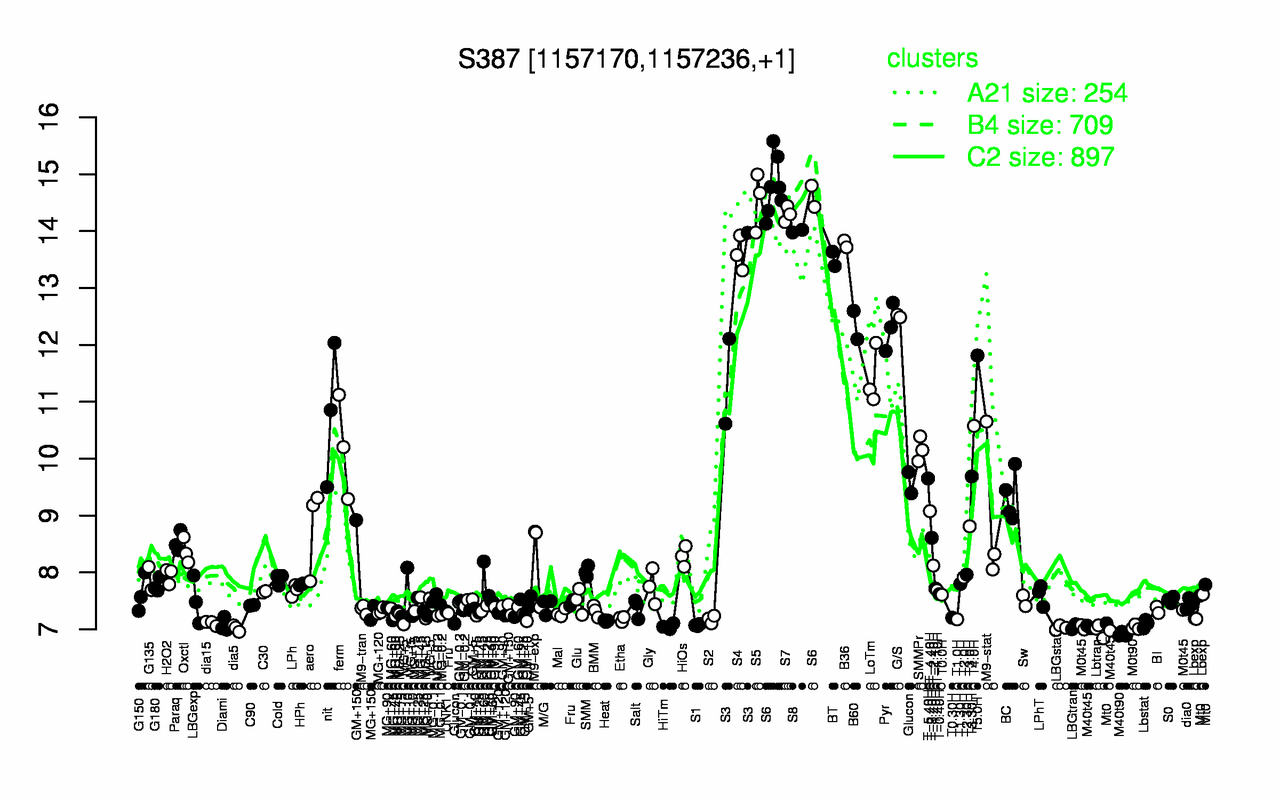
| S6 | S5 | S7 | S8 | B36 | S4 | BT | G/S | B60 | Pyr |
| 14.7 | 14.5 | 14.3 | 14 | 13.8 | 13.6 | 13.5 | 12.5 | 12.3 | 12.3 |
| M40t90 | Lbtran | dia5 | M40t45 | LBGstat | M0t90 | LBGtran | HiTm | S1 | Diami |
| 6.91 | 6.97 | 7.02 | 7.02 | 7.03 | 7.04 | 7.05 | 7.05 | 7.07 | 7.08 |