B. subtilis Expression Data Browser
Details about S409 Show/Hide
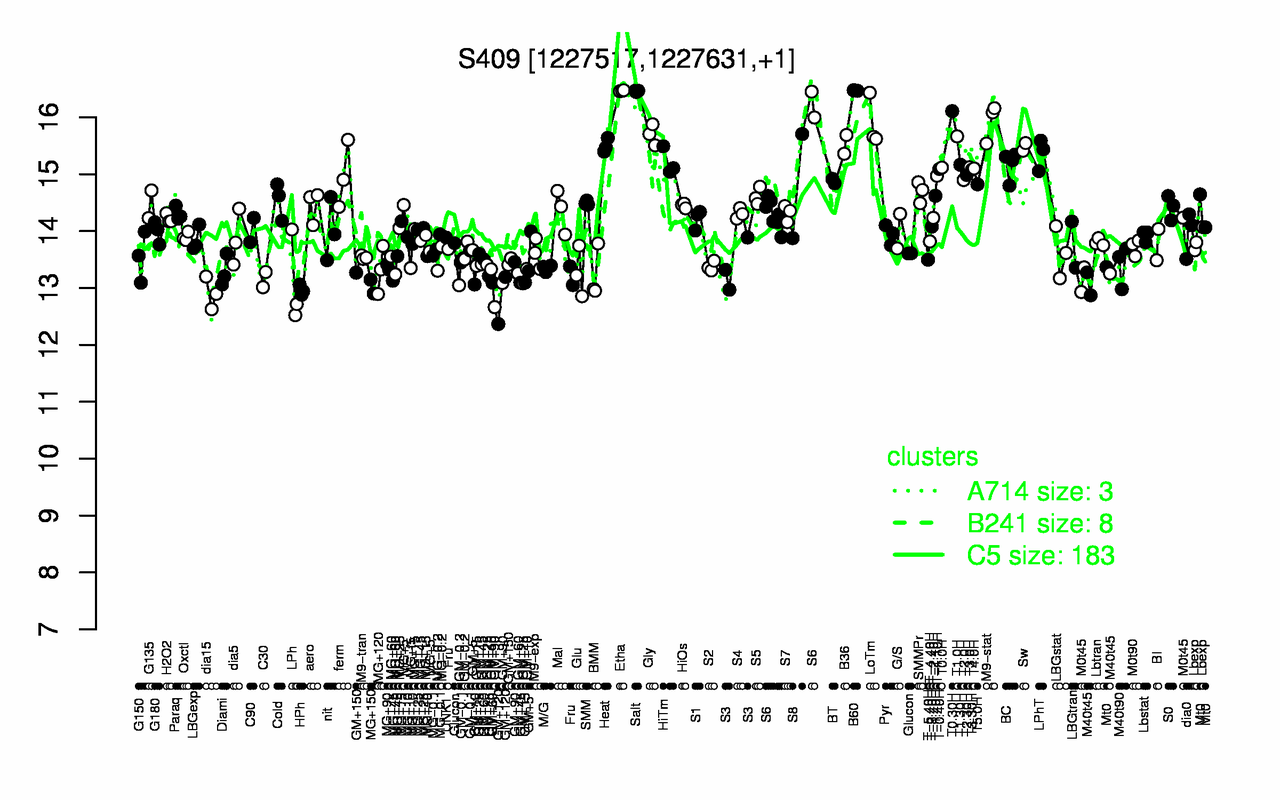
Highest Expression Conditions
B60 Etha Salt T0.30H M9-stat LoTm Gly T1.0H B36 Heat
16.5 16.5 16.5 16.1 15.9 15.9 15.7 15.7 15.5 15.5
Lowest Expression Conditions
GM+120 dia15 HPh MG+150 GM+90 LPh M40t45 C30 GM+10 GM+15
12.8 12.9 13 13 13.1 13.1 13.1 13.1 13.2 13.2
Most Positively Correlated Segments
yjbC S408 yfhL yfhM S1496 bmrU S1078 yjzE yvgO S1225
0.97 0.86 0.81 0.8 0.76 0.75 0.74 0.73 0.7 0.7
Most Negatively Correlated Segments
yjlA tyrS ileS yrvJ hisS ycbN ycbM ccpA lytC tsf
-0.64 -0.61 -0.61 -0.6 -0.59 -0.58 -0.58 -0.58 -0.57 -0.57
Expression Profile of Segment S409 Show/Hide
Genomic View of Gene/Segment S409 Show/Hide
(Legend)