| Start Page |
|
 |
| Start Page |
|
|
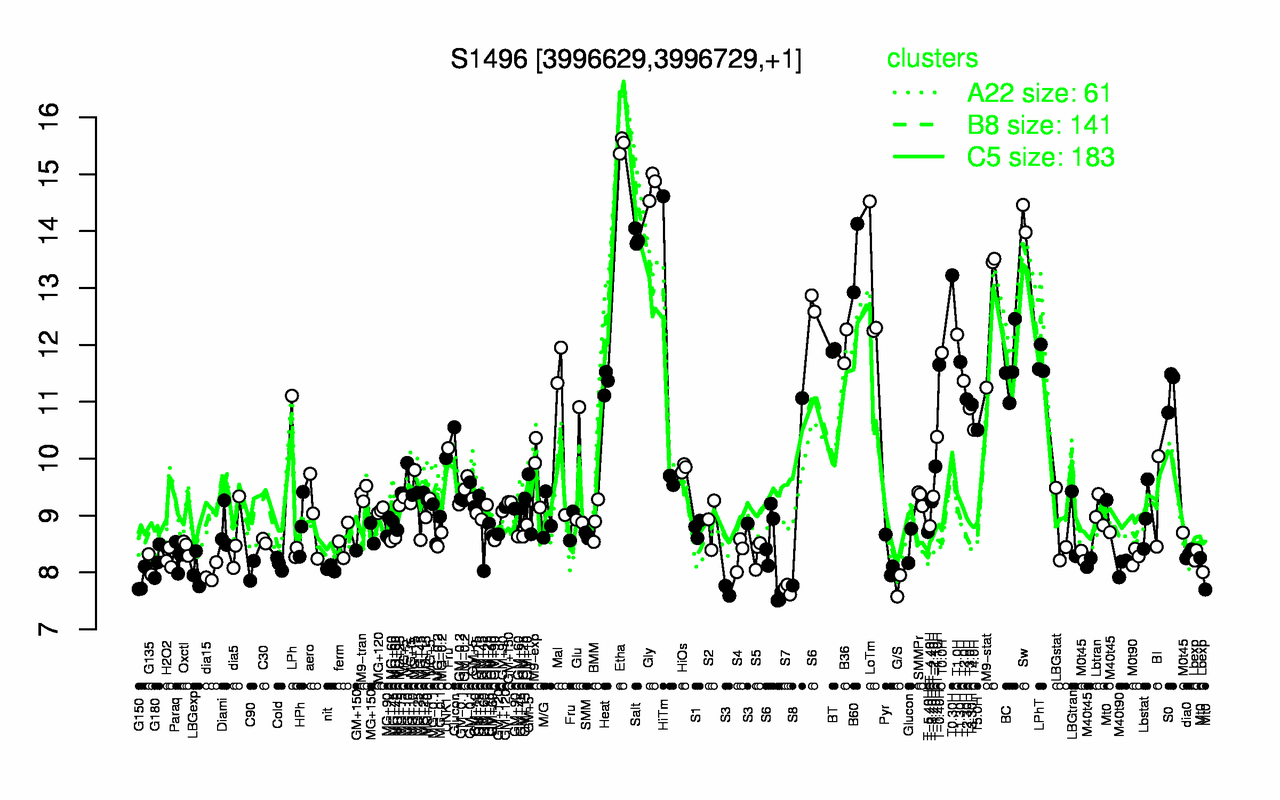
| Etha | Gly | Sw | Salt | B60 | T0.30H | LoTm | M9-stat | T1.0H | B36 |
| 15.5 | 14.8 | 14.2 | 13.9 | 13.5 | 13.2 | 13 | 12.7 | 12.2 | 12 |
| S7 | G/S | G150 | dia15 | LBGexp | C90 | nit | S3 | M40t90 | G135 |
| 7.71 | 7.76 | 7.84 | 7.98 | 8.03 | 8.03 | 8.07 | 8.07 | 8.1 | 8.14 |