| Start Page |
|
 |
| Start Page |
|
|
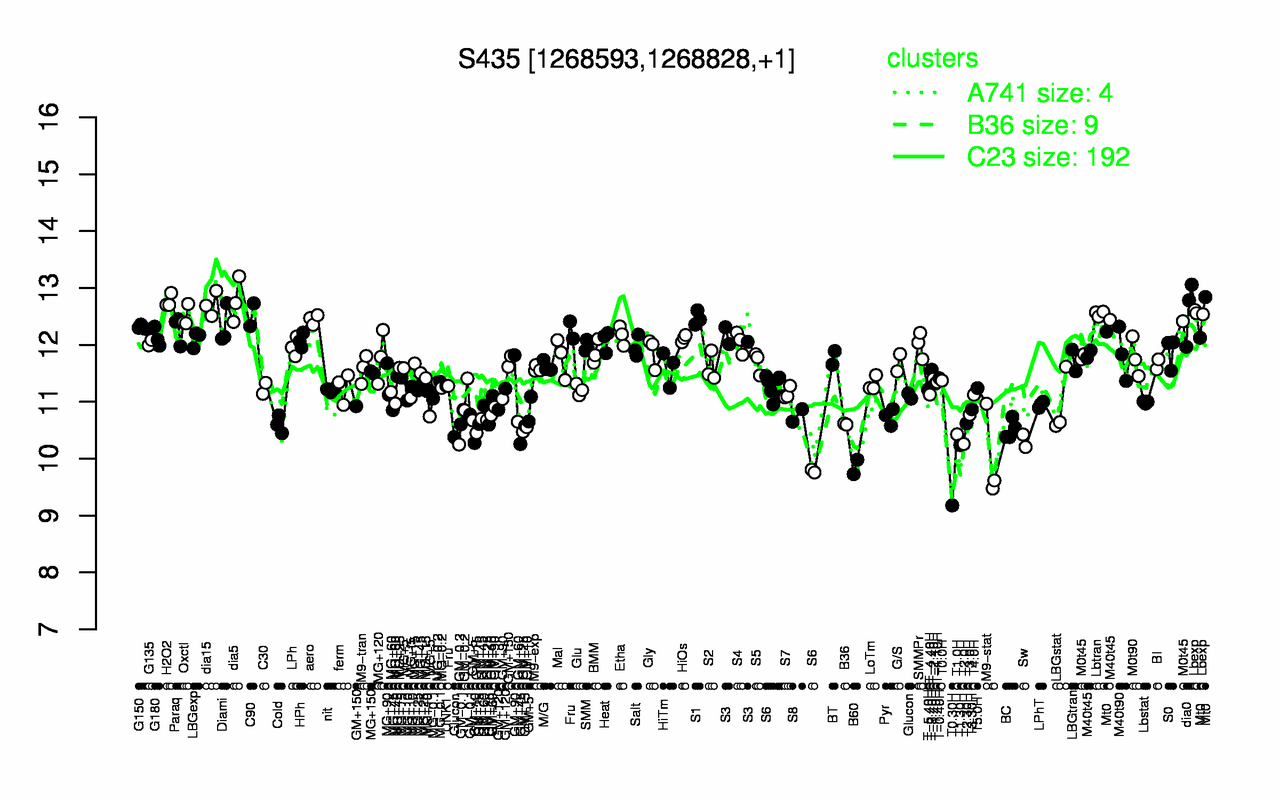
| dia5 | H2O2 | dia15 | dia0 | Lbexp | Lbtran | C90 | Oxctl | S1 | aero |
| 12.8 | 12.8 | 12.7 | 12.6 | 12.6 | 12.5 | 12.5 | 12.5 | 12.5 | 12.4 |
| T0.30H | B60 | M9-stat | T1.30H | T2.0H | Sw | GM+10 | T1.0H | BC | GM+15 |
| 9.18 | 9.85 | 10 | 10.2 | 10.3 | 10.3 | 10.4 | 10.4 | 10.5 | 10.5 |