| Start Page |
|
 |
| Start Page |
|
|
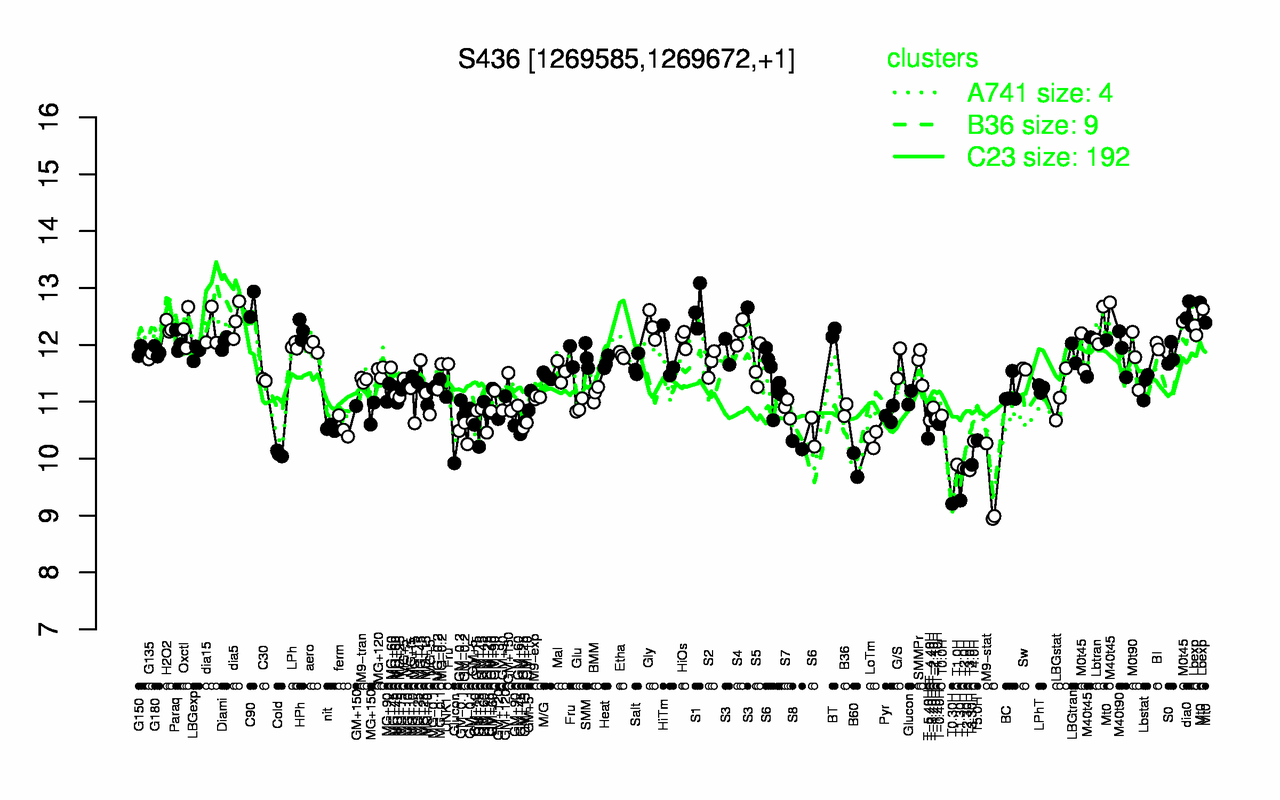
| C90 | S1 | dia0 | dia5 | Mt0 | Lbexp | Gly | H2O2 | Oxctl | Lbtran |
| 12.7 | 12.6 | 12.5 | 12.4 | 12.4 | 12.4 | 12.3 | 12.3 | 12.3 | 12.3 |
| T0.30H | T1.30H | M9-stat | T3.0H | T2.30H | T2.0H | B60 | T3.30H | T1.0H | Cold |
| 9.21 | 9.27 | 9.4 | 9.8 | 9.82 | 9.83 | 9.89 | 9.89 | 9.9 | 10.1 |