| Start Page |
|
 |
| Start Page |
|
|
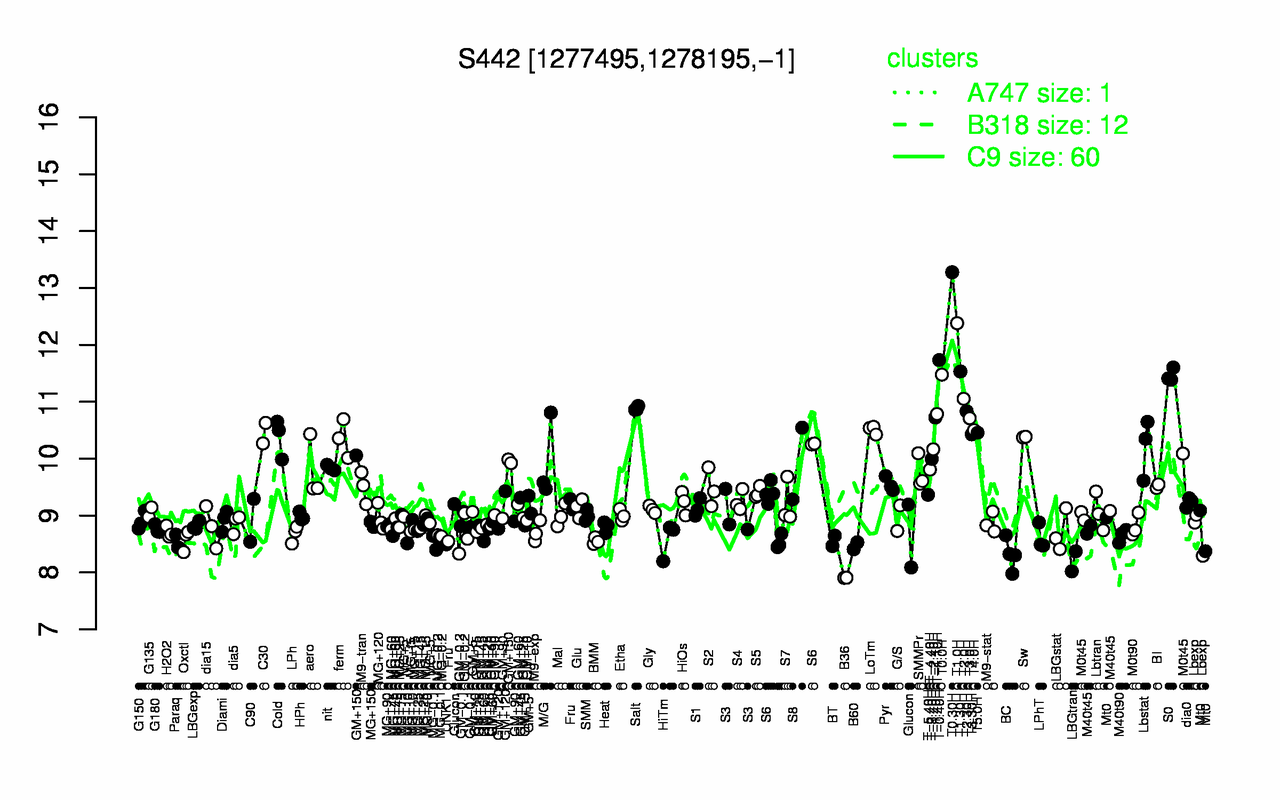
| T0.30H | T1.0H | T-0.40H | T1.30H | T0.0H | S0 | T2.0H | Salt | T2.30H | T-1.10H |
| 13.3 | 12.4 | 11.7 | 11.5 | 11.5 | 11.5 | 11.1 | 10.9 | 10.8 | 10.8 |
| B36 | LBGtran | BC | B60 | UNK1 | Paraq | BMM | BT | MG-0.1 | Oxctl |
| 7.91 | 8.2 | 8.31 | 8.47 | 8.49 | 8.51 | 8.55 | 8.56 | 8.56 | 8.58 |