| Start Page |
|
 |
| Start Page |
|
|
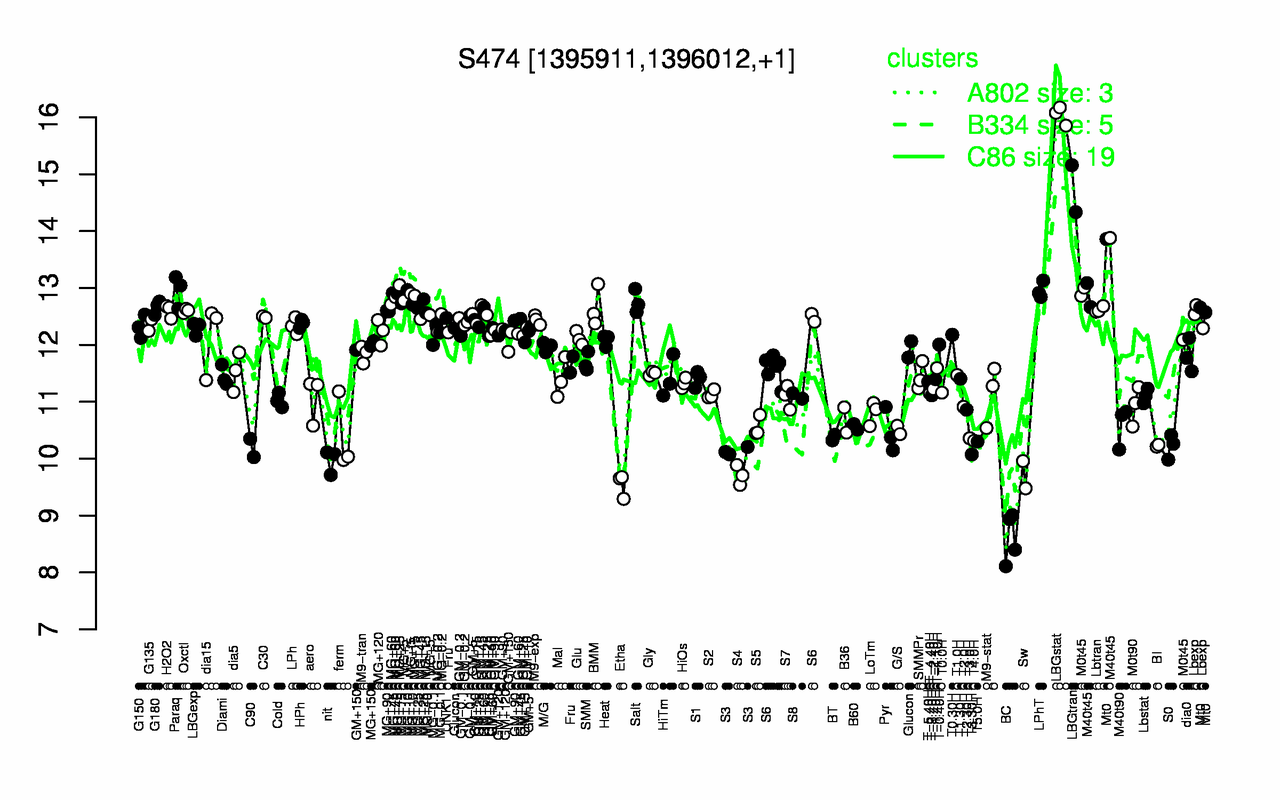
| LBGstat | LBGtran | M40t45 | Mt0 | LPhT | Paraq | MG+t5 | MG+25 | MG+60 | Salt |
| 16 | 14.7 | 13.2 | 13 | 13 | 13 | 12.9 | 12.8 | 12.8 | 12.8 |
| BC | Etha | S4 | Sw | nit | T3.30H | S3 | C90 | S0 | BI |
| 8.61 | 9.54 | 9.71 | 9.72 | 9.97 | 10.1 | 10.1 | 10.2 | 10.2 | 10.2 |