B. subtilis Expression Data Browser
Start Page
B. subtilis Expression Data Browser
Gene/Segment:
ktrA
Locus Tag:
BSU31090
Details about ktrA
Show/Hide
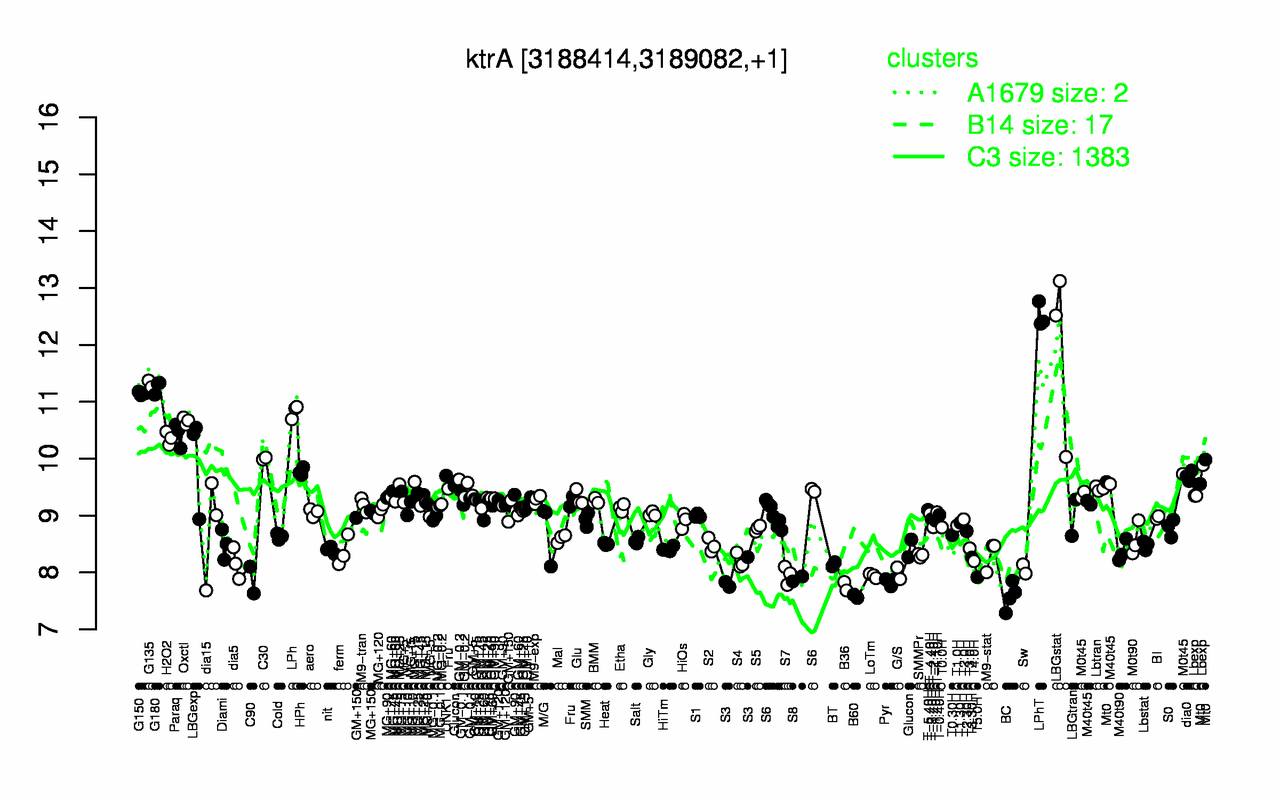
Highest Expression Conditions
LPhT
LBGstat
G135
G180
G150
LPh
Oxctl
Paraq
H2O2
C30
12.5
11.9
11.3
11.3
11.1
10.8
10.7
10.4
10.4
10
Lowest Expression Conditions
B60
BC
B36
Pyr
C90
S8
T5.0H
LoTm
S3
S7
7.58
7.58
7.76
7.84
7.87
7.89
7.92
7.94
7.95
7.96
Most Positively Correlated Segments
ktrB
prmC
yfhI
yvgT
yxdM
prfA
ydzS
yybS
ydzS
yyzO
0.92
0.76
0.73
0.72
0.72
0.71
0.7
0.7
0.7
0.7
Most Negatively Correlated Segments
citZ
yjcG
S1101
dat
S338
S1100
mpr
spoIIAA
qcrC
qcrA
-0.63
-0.63
-0.63
-0.61
-0.61
-0.6
-0.6
-0.59
-0.59
-0.58
Expression Profile of Segment ktrA
Show/Hide
Annotation of Gene ktrA
Show/Hide
function
16.1: Circulate
inference
ab initio prediction:AMIGene:2.0
codon_start
1
product
potassium uptake protein
transl_table
11
note
Evidence 1a: Function experimentally demonstrated in the studied strain; PubMedId: 12562800, 15096624; Product type t: transporter
db_xref
GI:2635593
protein_id
CAB15087.1
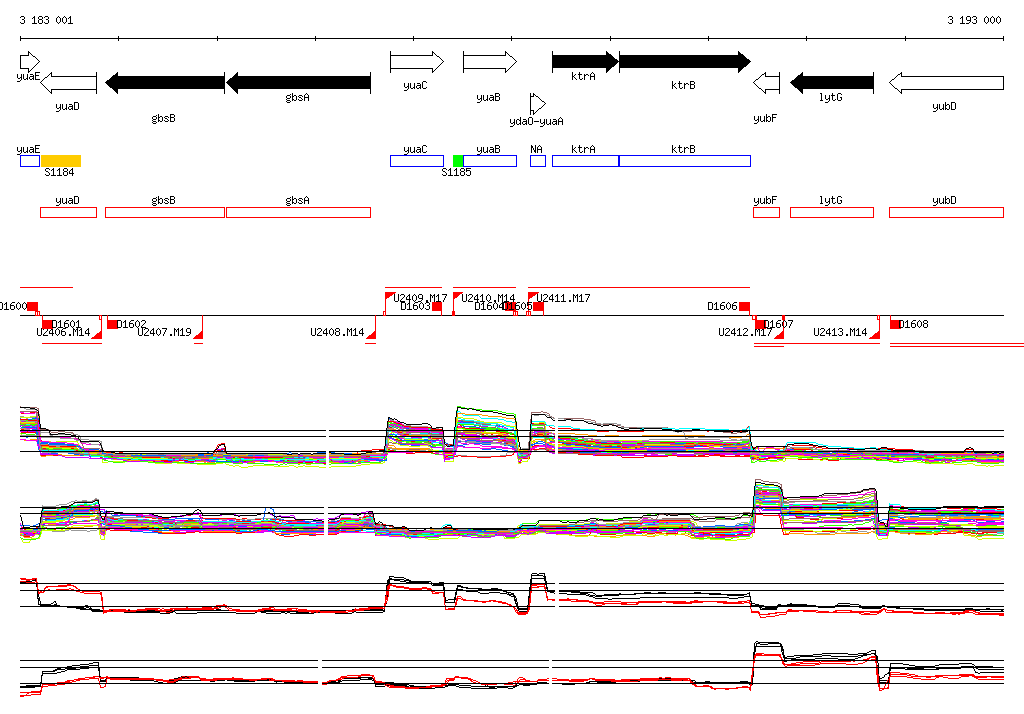
Genomic View of Gene/Segment ktrA
Show/Hide
(Legend)
Browse Genome Context