| Start Page |
|
 |
| Start Page |
|
|
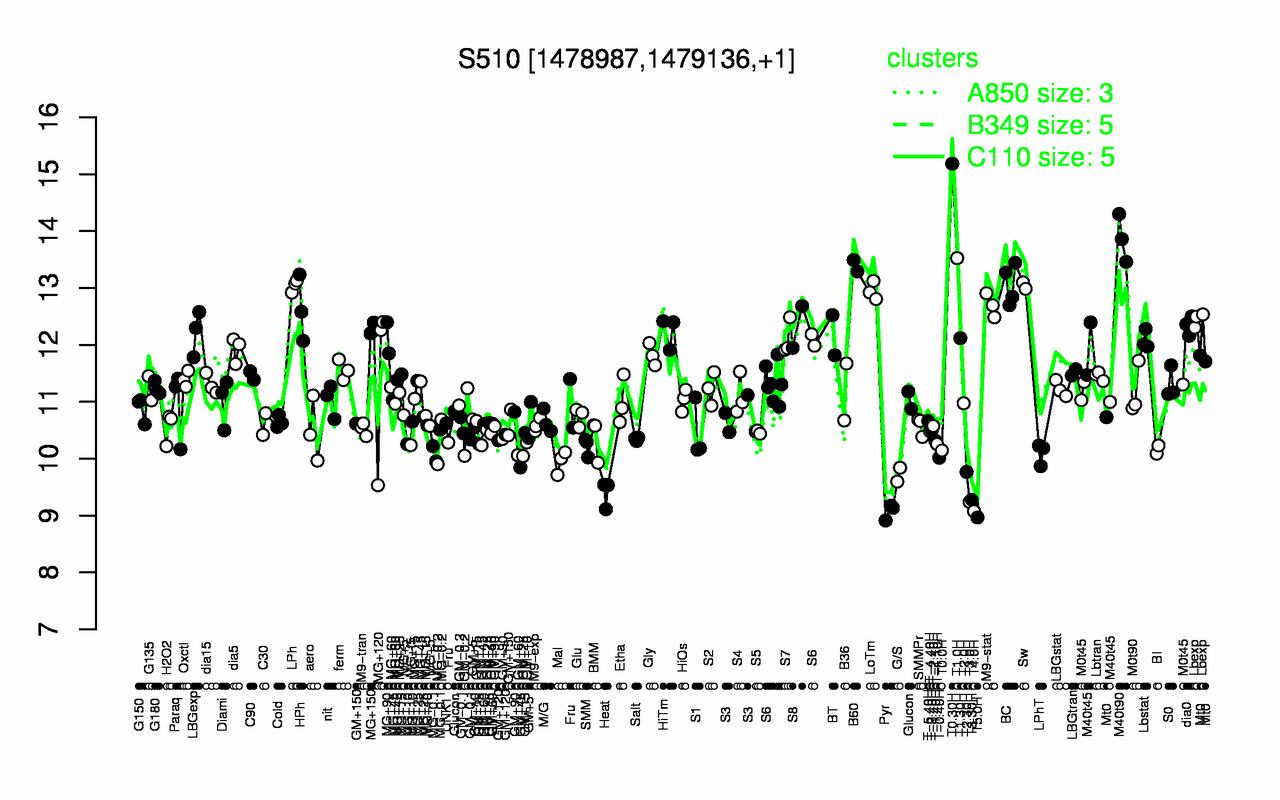
| T0.30H | M40t90 | T1.0H | B60 | BC | Sw | LPh | LoTm | M9-stat | HPh |
| 15.2 | 13.9 | 13.5 | 13.4 | 13.1 | 13 | 13 | 13 | 12.7 | 12.6 |
| T5.0H | Pyr | T4.0H | T3.0H | T3.30H | Heat | G/S | T2.30H | Mal | T-0.40H |
| 8.97 | 9.07 | 9.08 | 9.24 | 9.28 | 9.4 | 9.72 | 9.77 | 9.94 | 10 |